Following the changes in the cartographic production, the new Layout presents in gvSIG 2.1. The grid generating function is greatly improved. Now we will be able to configure almost all visual parameters and thus we can cover many of the needs that gvSIG community users had demanded.
We will see, with a very easy example, the new functionality of grid configuration.
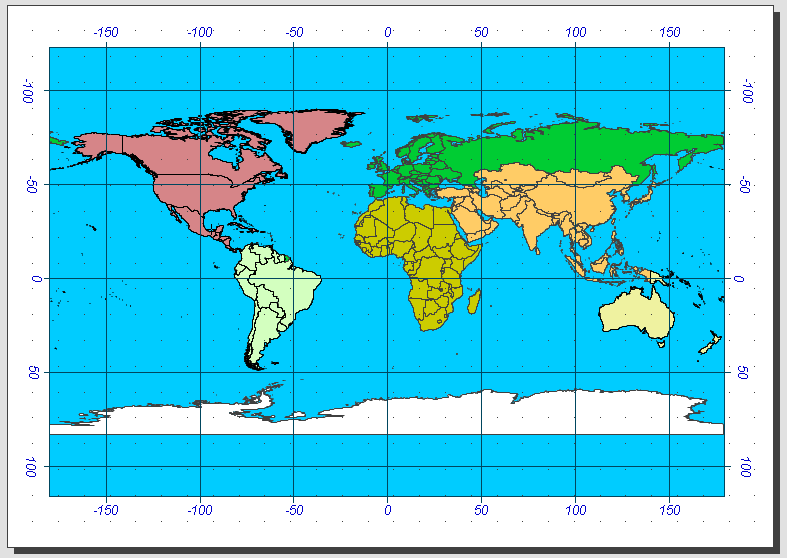
We start from a simple Layout where we will add a grid:
 If you were surprised to see the Table of Contents embedded in the document Layout, it is because you have not read last week´s post.
The first thing we do is select the View that is inserted on our Layout and display its context menu -clicking on it with the right-button. Among the options that it shows us, we select “Properties”. gvSIG will show a window and this one will be similar to the following image, where we can configure all the parameters related to a View:
 In this case we are interested in grid configuration. It is located at the bottom of the window. We enter in settings; we have to press the corresponding button. This will open a new window where you can configure every parameter of the grid:
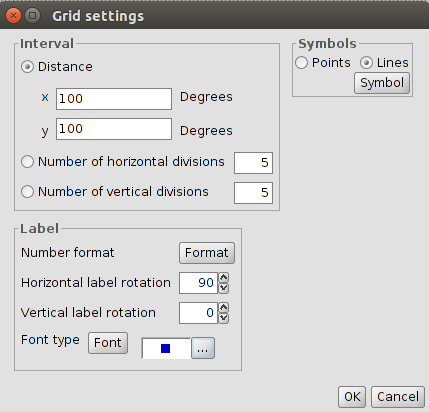 In our case, we will select that the grid will be symbolized by lines 100 degrees for both horizontal and vertical intervals. Also we will indicate the horizontal labels are rotated 90 ° (the rotation of this feature was one of the most requested by users). We configure the remaining parameters (font, size, color …) and we have our grid ready. Simple, really?