
When we create a layout in gvSIG, and we export it to PDF format or we print it, we sometimes can see that labels that we had added to the different elements of the map appear in a different size at the PDF file or in the paper. We can see the labeling in a correct way at the gvSIG layout, without being overlapped, but they are overlapped or they are not visualized because they are very small at the PDF file or at the paper.
It’s the same than the symbology. We can have several point or line symbol (for example, an airport symbol or a motorway line), that we see them in a correct size in a map, but when we print it or we export it to a PDF file they are very big or they can’t be seen.
The cause is because we are working in pixels instead of length unities (meters, kilometers…). The pixel is an immaterial concept that doesn’t have a concrete measurement, it is a cell measurement unity, they are “screen” unities.
For this reason, when we have the labels or symbols in a layout in pixel unities, we can see them correctly at the screen, but when we see them at the “paper space” we don’t have pixel unities, so it can change depending on the zoom/scale that we have at the screen.
![]()
PDF file created from a layout, with pixel unities
We can solve it selecting length units, like meters. At this way, we will have at the paper or PDF file the same visualization than in the screen. If symbols or labels are not overlapped at the screen, they won’t be overlapped at the PDF file or at the paper, we will see them at the same way.
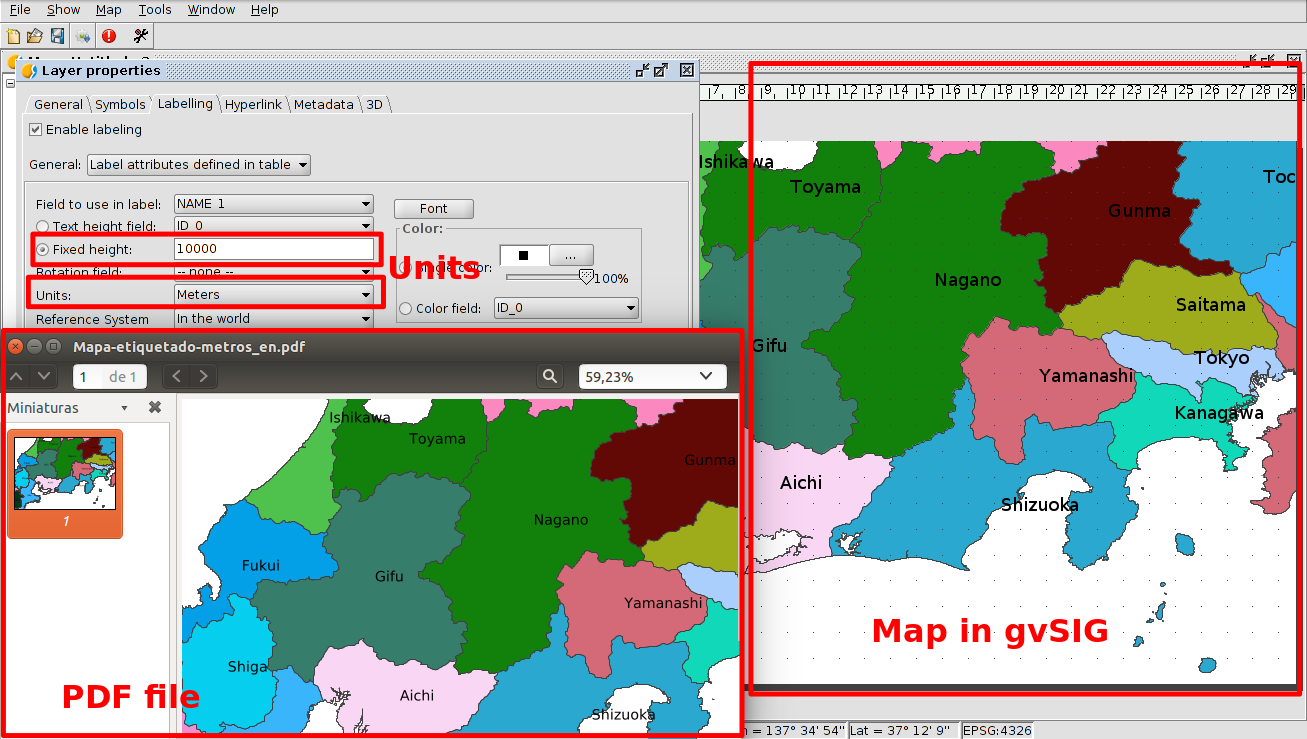
PDF file created from a layout, with meter unities
Depending on the scale that we are using we will have to select a different value. For example, if we are working with a complete country in a view, if we want to label the different regions we would be able to write 10.000, 20.000… meters for example, and if we are working in a local area, with municipality names, it can be 500, 1000… meter (of course it will depend on the size of our country).
It will be the same than the point (for example a hospital or a tree) or line (motorway, national road…) symbols, where we can work with a few meters. For example the size of a tree symbol size would be able to be about 4-5 meters.
To get the best results we will have to check it with different values until we visualize what we want at the layout.
In addition, at the labeling, apart from playing with the units as we have told, we also can use the advanced labeling (selecting “User defined labels” option at the first pull-down menu of Labeling tab at layer properties), where we can customize our labels (labeling each label in a different way, adding fixed text and a text from the attribute table…) as well as delete the repeated labels, avoid their overlap (indicating the priority of their location)…
We also will be able to select the interval of scale where the symbols or labels will be shown. For that we will install the extension about Create labels or Create legends by scale.
We hope that this information is useful for you!


