
All legends available in previous versions have been migrated to gvSIG 2.1, so now we have a wide range of possibilities to represent our data.
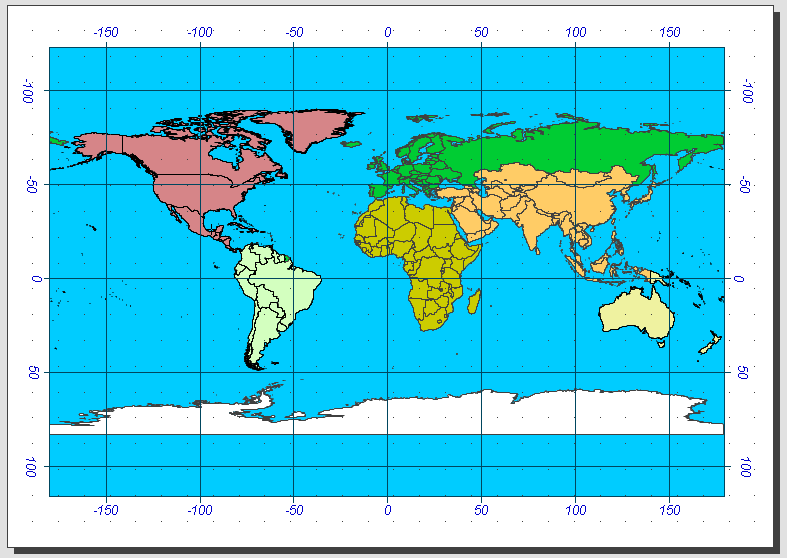
 Let’s look at some of these possibilities. We worked with a polygon layer to represent world administrative divisions.
By default, every element of the same layer has the same simbology “Unique Symbol” in gvSIG.
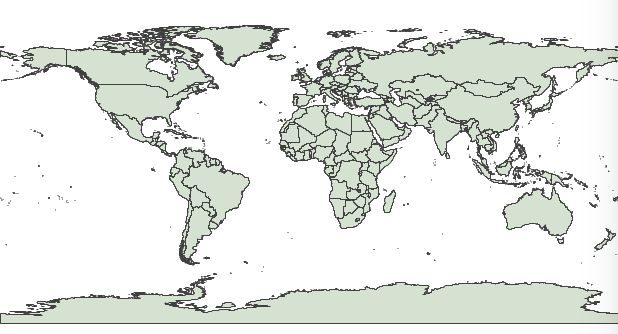 You can easily change simbology by clicking on Simbology Properties Editor and then select layer. Population attribute, available in this layer, will be used to show various ways to represent a numeric attribute and showing different types of visual results.
“Intervals” is perhaps the most common legend type to represent numerical data since this legend classify available values for each field in ranges of values. From population field we generate an interval legend as follows:
 Interval legend generates a map where it is possible to differentiate the world’s most Populated countries:
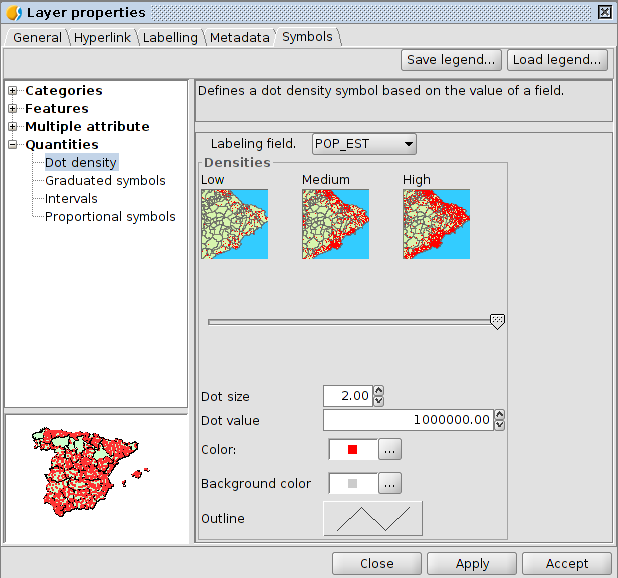
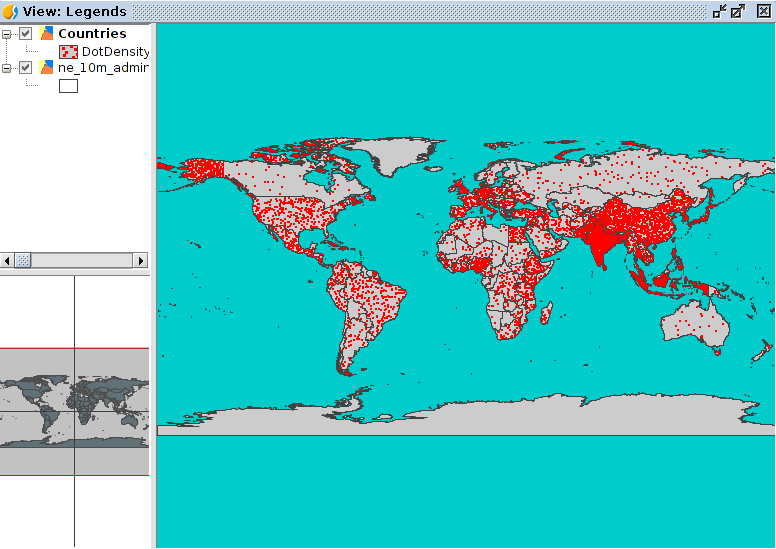
 Let’s take a look now how it changes our perception of reality as a result of the legend we use. Another example of legend would be “Dot density”. We’ll define a symbol point and a value for that point. In our case, each point will have a value of one million inhabitants. gvSIG will take the attribute value of population for each element and a point is drawn in a random way over the whole surface for each million inhabitants.
 The resulting image will give us different outcome from the previous legend. In this case, we are studying how to represent population density. We just need to look at countries such as Russia, Brazil, India and China to appreciate the differences between both legends.
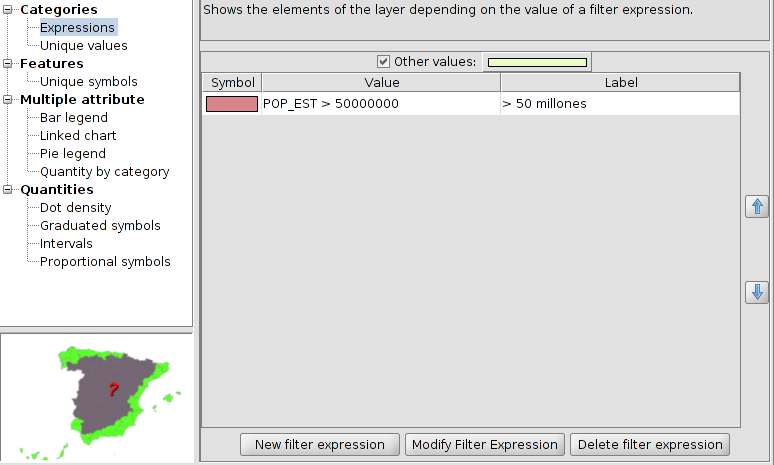
 Although graduate and proportional symbol legends also give us interesting information, the aim of this text is not to do a thorough overview of all legends. And so we now move on from legends of “Quantities” to legends of “Categories”. We have in this group one of the most common and basic types of legends: “Unique value legend”, which assigns a symbol for each unique value of the indicated attribute table. In our case, we will see using a simple example how “Expressions” legend works. A type of symbol is assigned to the elements which meet certain condition or expression. And of course, it is possible to have in the same legend as many conditions as we want.
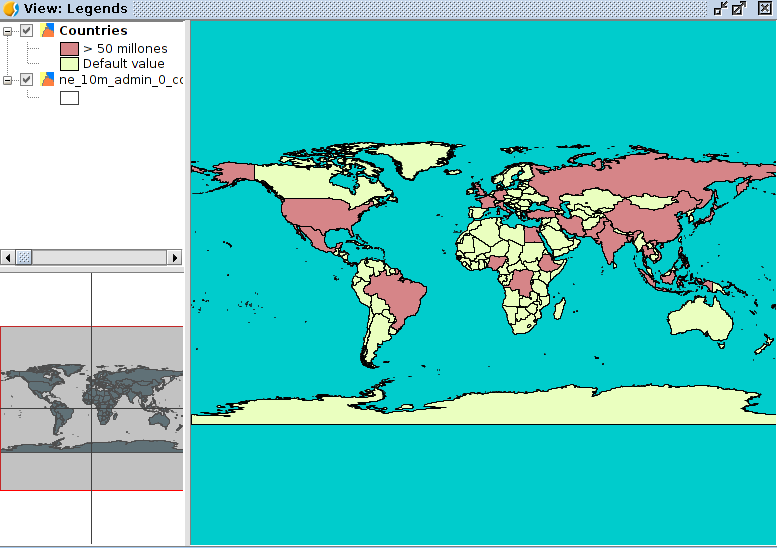
If we select this legend and click “New filter expression”, we shall see a window where we can build our expressions. In order to see how useful is this legend, we will see an example as easy as represent in the same colour all countries over 50 million inhabitants.
 We will select another one for all the rest of items which do not satisfy the condition:
 The end result will be an image like this:
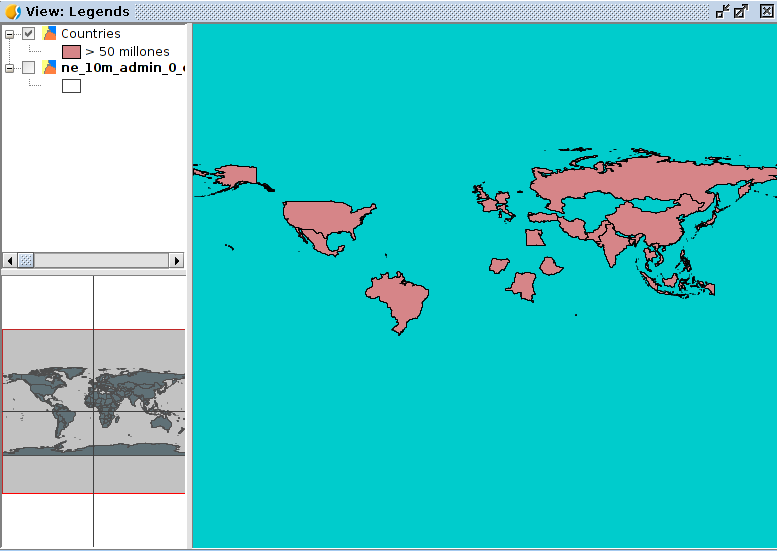
 If we are just interested in representing elements which satisfy the condition, it would be as simple as clearing the check box “ Rest of values”. We would have a map like this:
 Also, we have “Multiple attributes” legend where we can find bars and pies legend. If we use bars legend and click on zoom on the centre of Africa we would have an image like this, where population is represented with a bar graph:
 As you can see, there is a wide range of possibilities to represent the same data in very different ways. We have reviewed in tis post some types of legends included in gvSIG 2.1 and we could say that this new gvSIG version is very complete in respect of simbology area.





 Alvaro
 Amparo Cisneros
 adelrey
 Alegria
 asoredesocial2006
 Augusta
 christinesig
 cordin
 csanper
 danielvicb
 dispiste
 edmarmoretti
 elenasanchez232
 eliazerk
 fjsolis
 Gabi
Gabi ggowtham
 Giuliano Ramat
 Valenty
 Georg Sedlmeir
 hydrologiclady
 jgalans
 Joaquin del Cerro
 Juan Lucas Domínguez Rubio
 jolicar
 josebadia
 Jorge Piera Llodrá
 Jordi Torres
 Chevi
Chevi learozz
 leoruizb
 Alonso Morilla
 Lluís Marqués
 martapacoret
 Óscar Martínez
 mateoboudon
 mateocb16000
 Mario
Mario Mario Chaveli
 mjlobato76
 Manuel
 mmontesinos
 moovida
 Nacho Varela
 nbrodin
 André
André piotrpachol
 psanxiao
 Sergio Acosta y Lara
 Spatioblog
 Sergio Acosta y Lara
 uliwerz
 Victor Acevedo
 Viqui
Viqui volaya


