
Last post was about symbology in gvSIG Desktop. Today we will be introduced in “Labelling”.
A label is the text which describes one or more attributes. The labels are located over or close to the elements of one layer, according to the labelling characteristics defined by the user, as well to the changes of the View. Note that labels cannot be modified by users directly.
There are two different ways of labelling in gvSIG, one basic and quick, and another one, a little bit more complex, with multiple options that allows to set up the characteristics of the labels.
Like for symbology, gvSIG has a wide range of tools to manage the label variables. To learn more about labelling, please check the “Labelling” section in the user guide.
Let’s do now an exercise, using the basic labeling command to place the labels over the “Political” layer. We will begin by opening the layer “Properties” window. To do that, we can select Layer > Properties with the layer active, in the menu, or right-click on the layer name, in the Table of Contents.
In the “Layer Properties” dialog box, click on the “Labelling” tab. Then, click on the “Enable labelling” check box to enable all the basic labelling options.

Here, we should choose the field in the attribute table will be shown in the maps as labels. In the case of our exercise we select the field “name”, which stores the name of each kingdom. We will set “12” as the size font, and leave the others settings by default. Click “Apply” and /or “OK” and the result will be as shown below.

If we want to hide (or show again) labels, we should click on the “Labelling” tab in the “Layer Properties” dialog box, and then, we uncheck or check the “Enable labelling” box.
If we want to have more control over the labels, we should pick the option “User defined label“ in the “General” drop-down menu, instead of the “Label attributes defined in table” that is shown by default. Then, in the “Classes” drop-down menu, we pick the option “Label features in the same way” in the “Method” option. The window changes as shown below:

As we said before, labelling tab is plenty of options. You can learn more about this in the gvSIG user guide. In our example, we will use some of these options to learn how labels might change.
If we click on the “Properties” button, the “Label class properties” window is opened:

We will begin by defining the field we want to use to label features. To do this, click on the button “…” in the “Labelling Expression”.
A new window is opened, as shown below. Here, select the field to label features -in our case is “name”- and then click on the “Add field” button.
The labelling expression could be more complex if we create SQL queries but in this example we will just use the field “name” like in the basic label, explained before.
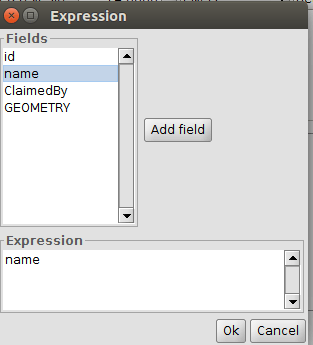
By clicking on the button “OK”, the selected field appears in the “Labelling expression” box.

When you label a layer, you might want to modify the visualization of the labels. gvSIG, allows you to change some label properties, such as font, color, or size. This option is not available in the basic labelling options but only in the advanced options by checking the box “Use halo”. This enables you to choose the format and the font settings.

Once the label properties are defined, click on “OK” to close the “Label class properties” window. Now, back in the “Layer properties/Labelling” window, click on the “Placement” button to open the “Placement properties” window shown below:
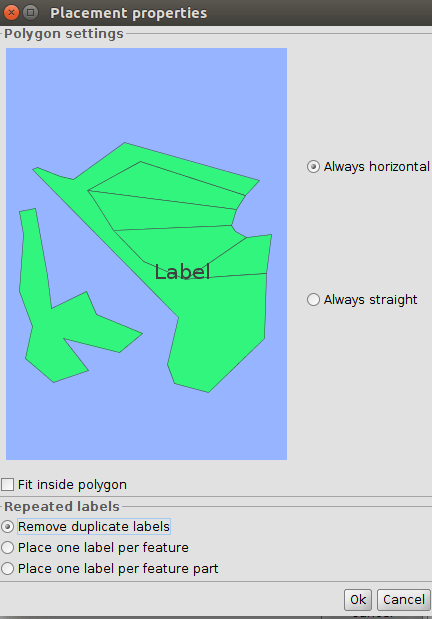
Here, click the “Remove duplicate labels” radio button and then “OK”. You might want to try out other options and note the differences.
Finally, click on “Apply” in the labelling tab of the “Layer Properties” window and the labels are placed.

Here is this post. We also recommend you to explore other options like the one which allows you to label features considering the scale of the printed map. By the way, the labelling options may change depending on the layer features (points, lines, and polygons).
There are only four posts left to finish this mini-course. Hope you find this innovative introduction to the GIS systems interesting.


Pingback: Learning GIS with Game of Thrones (XII). Graphic editing tools | gvSIG blog