
As we announced in a previous post, we are describing the basis of the methodology developed by the gvSIG Association and New York University (NYU) within the project “Monitoring Global Urban Expansion”, for assessing the quality of urban layouts.
Metrics
The objective of the methodology is to measure the following features:
- Land Use Areas and Shares
- Proportion of Street Space
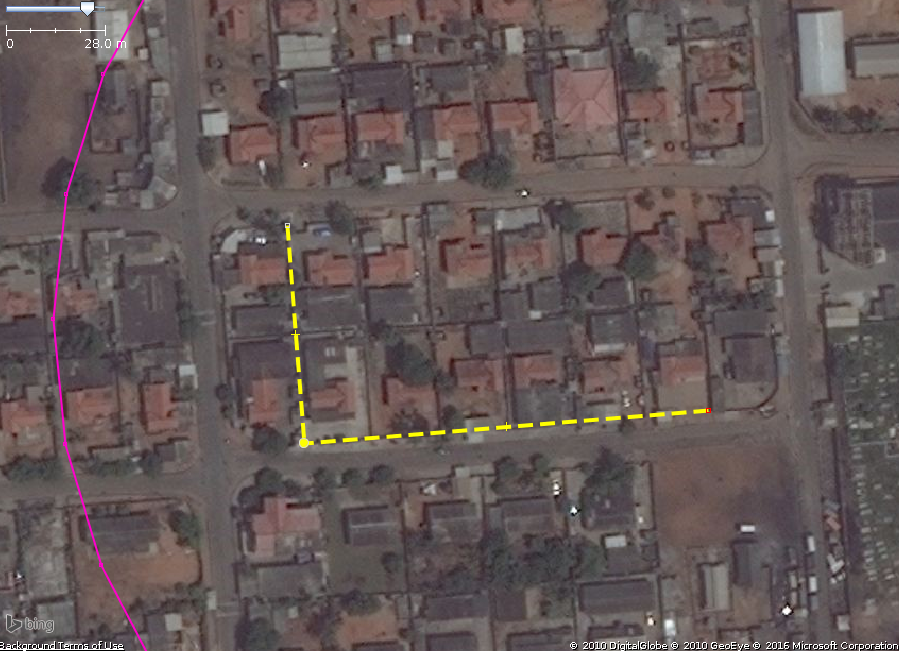
- Street Widhts
- Block Size
- Intersection Density
- Walkability
- Plot Dimensions
- Access to Arterial Roads
All these features were obtained from vector cartography through geoprocessing algorithms. The first step therefore was creating the necessary cartography. For this we used an Open Source mapping software from the OpenStreetMap project called JOSM. The main data sources used were Bing and MapBox satellite imagery.
Sampling
Since mapping the entire cities would not be affordable we considered using sampling methodologies: a quasi-random sequence called Halton, which has the advantage of providing points with a very good spatial distribution but still they are random, which is very important from the statistical point of view.
 Around each point in the sequence within the study area we drew a circle with an area of 10 hectares called “locale” in which we focused the analysis. It is woth stressing that each locales was given a unique identifier with the aim that they can be used in future studies.
Depending on the size of the study area different locale densities were used: for areas smaller than 25 Km2 we generated 4 locales per Km2 while for areas larger than 25 Km2 we generated 1 locale per Km2.
Land Use classification
Before the digitization we established a classification of land uses including the following categories:
- Open Space. It mainly refers to any unbuilt areas, particularly:
– Open countryside
– Forests
– Crop fields
– Parks
– Water bodies - Non-Residential. It includes built-up areas that are not for residential use such as:
– Industrial parks
– Railway stations and tracks
– Bus terminals
– Airports
– Schools and universities
– Shopping centers - Residential. For residential areas we established 4 subcategories depending on the stage in their evolution and particularly considering the following main factors: homogeneity of structures, regularity of the street network and quality of public services.
- Atomistic: areas that were not laid out or subdivided in advance of the residential development.
- Informal Land Subdivision: subdivided areas that lack of some public services, particularly paved streets and sidewalks.
- Formal Land Subdivision: similar to the former category but with high level of infrastructure.
- Housing Project: areas where structures are homogeneous because they were built off the same plan. It may include from apartment towers to suburban tract housing.
Digitization
For each locale the following elements were digitized:
- Locale Boundary. It’s the circle itself except when an overlap between two circles take place, in which case one of the circles is clipped. From this element we get the total area of the locale.
- Blocks. Contains the boundaries of all the blocks falling within the locale, tagged according to their land use category.

- Plot Measurements. In those blocks in which the plot size was regular and plot boundaries were easy to identify some measurements on plot depth and width were taken.

- Road Medians. We digitized the road medians around all the blocks intersecting or completely included in the locale.


Sample representativeness
In order to guarantee the representativeness of the sample we proceed as following: we digitized an initial set of 40 locales; then we calculated all the metrics, the average values and, through a statistical test, its degree of confidence. Until a high degree of confidence was reached we kept digitizing locales.
Digitization of Arterial Roads
Simultaneously to the digitization of locales we carried out the digitization of all the Arterial Roads of each city, which are those roads that are more than 18 meters wide and, at the same time, are connected to other roads more than 18 meters wide.
Metrics calculation
Once all the necessary elements were digitized we proceed to the calculation of the metrics using two Python scripts, one for the locale metrics and a second one for the Arterial Roads metrics.


Manuel, ¿cómo estás? Estoy tratando de aplicar el índice a partir de esta misma metodología a São Paulo (Brasil). Pero estoy teniendo problemas para generar automáticamente los puntos aleatorios como la propuesta técnica (cuasi-aleatorios Halton puntos). Dentre las herramientas intaladas solamente la ‘herramientas para capas vectoriales “>” capa vectorial con geometrías aleatorias’ entiendo cómo aplicable, pero creo que no corresponde a la propuesta de Halton.
Me gustaria saber si sabes ¿cómo puedo hacer a través de gvSIG o otra solución para generar estos puntos de forma automática (o coordenadas)?
Gracias!
Hola Yuri,
Los puntos de la secuencia no los generamos con gvSIG sino con una hoja de cálculo que diseñaron específicamente para ello en la Universidad de Nueva York. Voy a pedirles permiso para compartirla contigo. Por favor déjame tu email y en caso de que acepten te la enviaré por esa vía.
Saludos,
Manuel.