
At this second-to-last post of the course to learn the base of the Geographic Information Systems through practical exercises with Game of Thrones data we are going to work with the “Map” document.
A Layout document is a set of design elements of a map, organized in a virtual page, the objective of which is its graphical output (printing or exporting to PDF file). The elements that we see in the design are the elements that are printed or exported to the PDF file, being in the same paper size that we have selected on the screen. We can add two different type of elements in a Layout: Cartographic elements and design ones.
In our case we are going to create a map with the path followed by Greyjoy brothers, that we drew in the post about “Graphical editing“.
Once we have our project open in gvSIG, firstly we are going to open the “Project manager” window. A fast way to do it is through the “Show/Project manager” menu. We select the “Map” type of document and we press “New”. A new window will be opened, where we can define the characteristics of the Map page.

In our case we are going to select “A4” for the page size, then “Horizontal”, and we will select the View where we had our layers loaded instead of “Create new View” option. If you have more than one View in your project you will see a list with all of them.
You will see that a new map is created where the indicated View is added with a full extent at the page:

Pressing on the “black squares” that appear in the borders and medium points of the rectangle that defines the View extension we can change its size. At this way we are defining the design of our map. Clicking on the View element inserted and dragging it we can move it. In our case we resize the View inserted and we move it, and now we will insert other cartographic elements.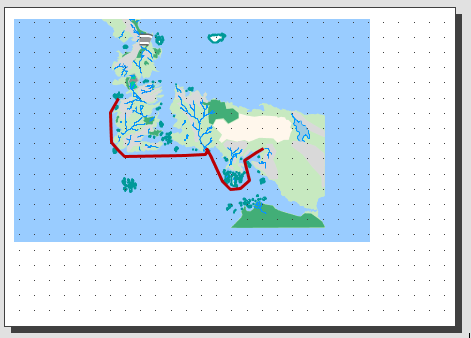
Most of the cartographic elements are closely linked to a View document, so that when making changes to the View, they can be reflected in the map (changes of zoom, displacements, legend changes, organization of layers, etc.). These tools are available from the “Map / Insert” menu and the corresponding button bar.
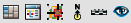
Let’s start by inserting the legend. This tool is available from the menu “Map / Insert / Legend” or from its button:

The legend is always associated with a View inserted in the Map and allows to represent the symbology of the different layers of that View. Once the tool is selected, we will indicate the first end of the rectangle defining the space to be filled by the legend. It will be indicated by clicking on the Map area at the desired location, and dragging until released at the opposite end. A dialog box will appear where you can define the graphic properties of the inserted legend:
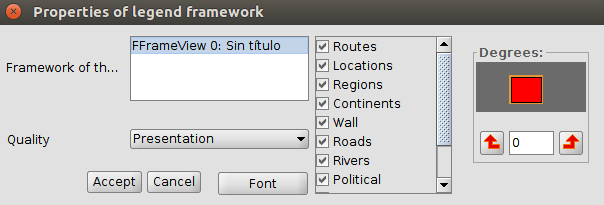
In this window we can mark which layers (its symbology) we want to show in the legend.. 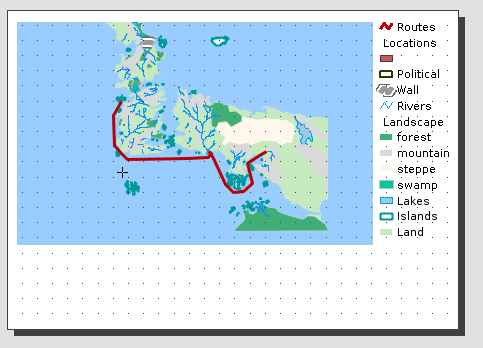
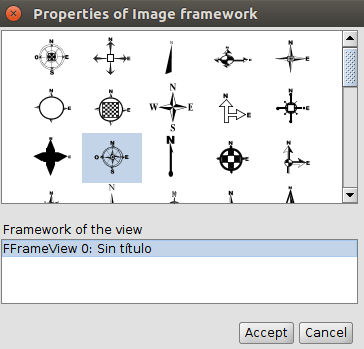
Next we insert a North symbol. This tool is available from the “Map / Insert / North” menu and from its corresponding button:
Once the tool is selected, the first end of the rectangle that defines the space to be occupied by the north symbol will be indicated by clicking on the Map area at the desired location, and dragging until released at the opposite end. A dialog box will appear where you can define the graphic properties of the inserted north:
And our Map will be like this one: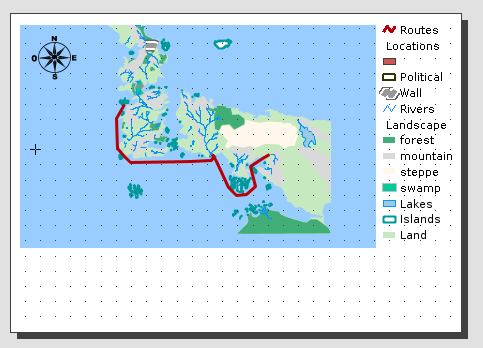
Finally, we will insert a title using the “Insert Text” tool (in the Map / Insert / Text menu or its corresponding button). The operation is similar to the other elements, and in this case we will indicate the text that we want to write: “Greyjoy Brothers”.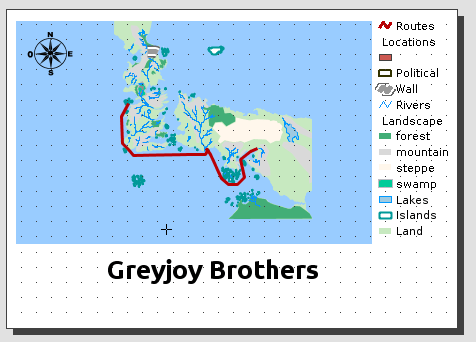
From here, to avoid extending this post, we recommend you to review the documentation related to the Map document where you will be able to see how to add graphic scales, boxes, etc. With practice you can create really well designed maps.
Once you have your map you can export it to a PDF file from this button:
You can send your PDF file to all your contacts already.
As it’s said, practice makes perfect.
To finish the course there’s only one post pending… don’t miss it.


