
Starting as a final project for a Master in Visual Analytics and Big Data, a new plugin for gvSIG 2.4 has been developed. Its mainly porpouse is to search for new ways to analyze and visualize data for extract knowledge from it.
This tool is denominated “Statistics Viewer”. It has a group of tools.
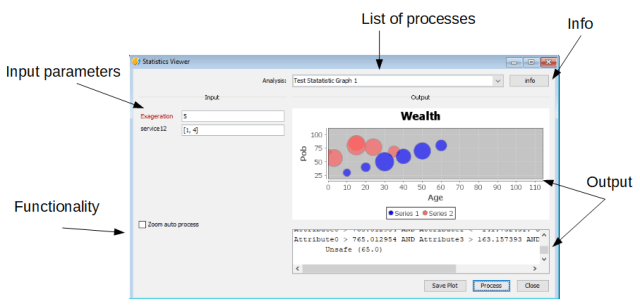
In the menu you will find all the processes available
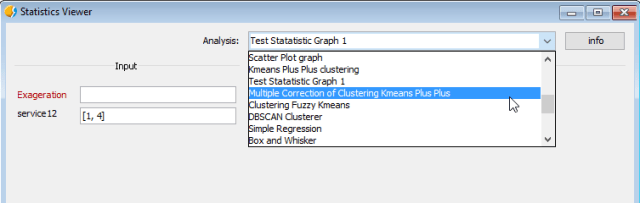
They are divided in 3 categories:
- Statistical
- Clusterization
- Utility: for download future new processes or test the app.
The statistical process are oriented to error detection in the alphanumeric values. This errors are difficult to find if there are no specified tools for it. Also, they will help us to learn about the meaning of our data.
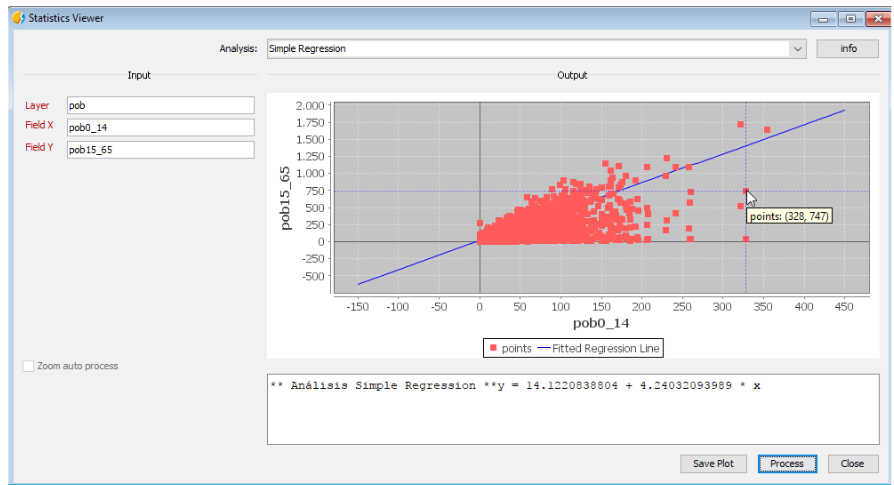
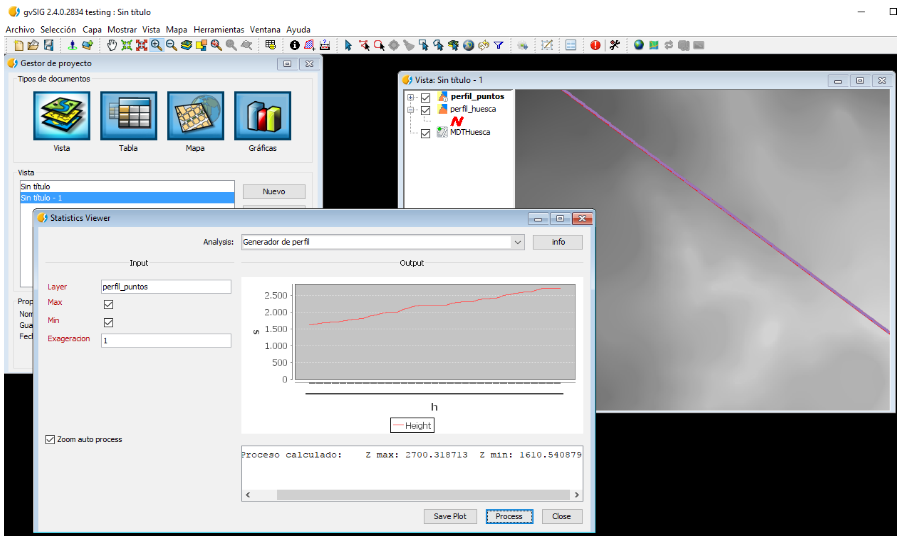
For example, in the last picture, we can see a linear regression from two fields of a vector layer. Each point makes reference to a different feature. Also, you can click the point and automatically it will be selected in the layer loaded in the gvSIG View.
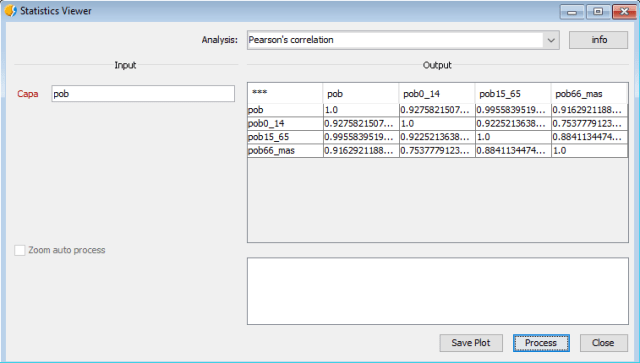
Other processes to help us to find relation between fields are: Pearson’s correlation and the covariance matrix.
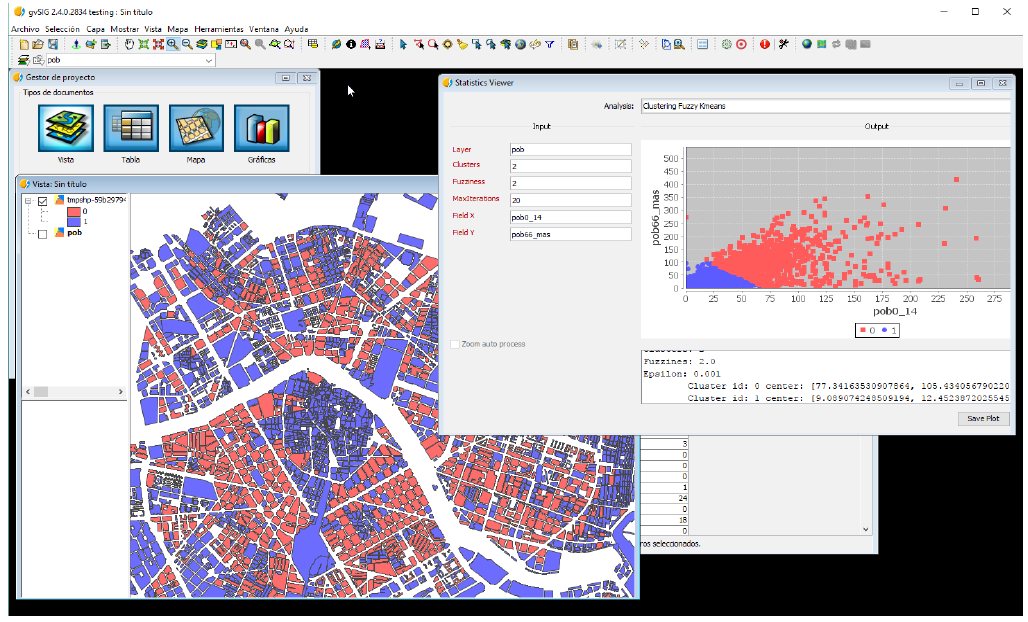
Another important processes are clustering processes. They will allow us to group features. Our analysis will not be just limited to the spatial component.

The next image shows another cluster creation using two fields.
Also, there are utility function in the plugin. For example, with the auto zoom option activated, the process will be executed each time we change the zoom in the view. This is usefull to explore dynamically our data. The output in the graph its related with all the points that we see in the gvSIG View.

As we change the View, the process is auto executed and the output changes.
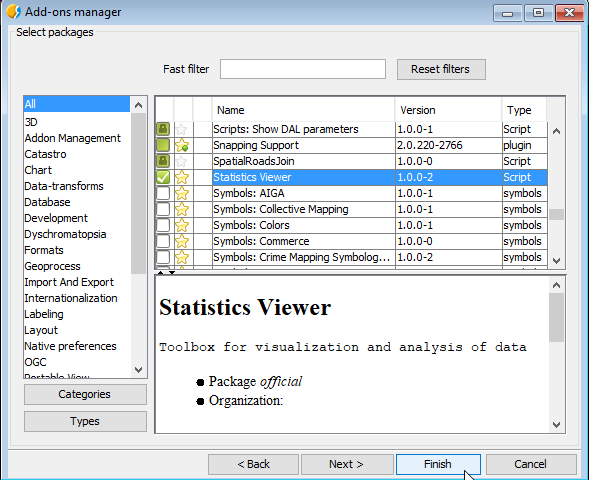
This plugin is available for testing in gvSIG 2.4 and it can be download it from Tools – Addons Manager – Online repository and it will appear as Statistics Viewer.
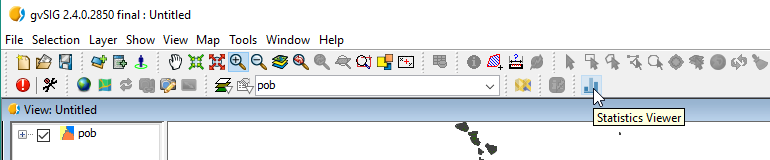
Once it’s installed, gvSIG need to be reopened. Then it will appear a new icon in the tool as it shows here.
To use it: It need to be opened after a View is created. Select the desired algorithm and fill all the parameters manualy. If a layer is required, it will need the name of the layer as it appears in the Table of Contents in the gvSIG View.
This tools is in its first stages and is currently in development, so the options are limited. It has been realized with the Scripting Module and using Jython as language. Also it uses other libraries, Jfreechart for graphics representations, and Apache Commons Math for cluster analysis.
Code can be found in Github. Any feedback will be appreciated.


Pingback: New plugin for gvSIG 2.4: Statistics Viewer – GeoNe.ws
Pingback: First gvSIG 2.5 build for testing is already available | gvSIG blog
Pingback: First gvSIG 2.5 build for testing is already available | gvSIG blog
Pingback: gvSIG Desktop 2.5 has arrived: Downloads are available now! | gvSIG blog