
The new gvSIG Desktop version, gvSIG 2.5, is available to download with a lot of new features and improvements. Some of these developments imply, by themselves, improvements of great relevance. All of them multiply the potential of gvSIG Desktop as we haven’t seen until now. Some new functionalities can also be used in previous versions.
Below is a brief summary of the main novelties.
Quick Drawing
Sometimes we need a tool that will allow to take quick notes over the map. The objective of this notes can be explicatory of certain characteristics of the map, reminders of certain work that we need to do, etc.

This tool allow to draw over the with points, lines, geometric figures or hand free drawing. In the tool we can see the attributes of this geometries. You will be able to choose some characteristics like label, size, color, font, etc.
More info: https://blog.gvsig.org/2019/11/04/towards-gvsig-2-5-quick-drawing/
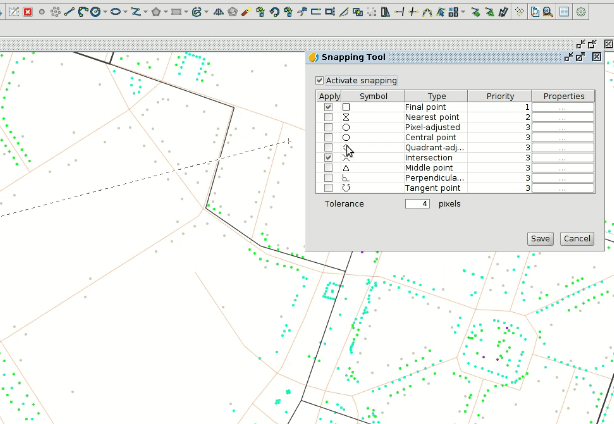
Quick access to Snapping tools
The window that allows you to configure the type of snapping (end point, medium point, near point …), and the tolerance in pixels, was inside the “Configuration” window in previous versions. In addition, if we wanted to activate or deactivate snapping we had to use a quick access key or use the command available at the “Edit” menu.
Thanks to the “Quick access to Snapping Tool” plugin we will be able to access the snapping options at any time and we can leave the floating window while editing. In this waywe can change the available options at any time.
More info: https://blog.gvsig.org/2019/03/28/towards-gvsig-2-5-quick-access-to-snapping-tools/
Capture coordinates
It allows to capture the coordinates of a point indicated by the user, both in the view reference system … and in any other. It also allows us to copy the point coordinates to the ‘Clipboard‘, and then paste them into other applications.
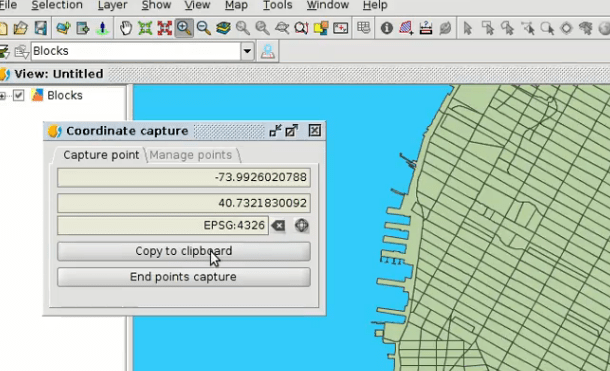 It can be used from different gvSIG 2.5 tools such as geoprocesses, field calculator, attribute selection or editing tools.
More info: https://blog.gvsig.org/2018/04/24/new-plugin-available-to-capture-coordinates/
Listing layers at the Table of Contents
Through this new plugin we add a series of new options to the Table of Contents to list or group the layers of our View.
Besides the main list, now we can list the layers according to the source, if they are visible or not, and if they have selected elements or not. The procedure is very simple, you have to click on the icon on the top of the TOC and it allows to access to any of the grouping methods.
 More info: https://blog.gvsig.org/2019/02/28/towards-gvsig-2-5-listing-layers-at-the-table-of-contents/
New image viewer
The previous viewer simply showed the image in its original size. With this new viewer users will be able to see the image scaled to the size of the window, enlarge or reduce it and even rotate it.
 More info: https://blog.gvsig.org/2019/02/07/towards-gvsig-2-5-new-improved-image-viewer/
Hiperlink on KMZ files
It allows to consult the images included in KMZ files.
Saving export parameters and new functionalities
In the new gvSIG Desktop 2.5 we will have the option to save the export parameters of our exportations.
For certain types of projects we’ll usually make the same exportations: certain layer export to one folder, with certain name, certain projection, certain fields, etc. With this new functionality you’ll be able to save this parameters.
Two new functionalities:
-
History: save all the exportations that we made
-
Bookmarks: save the exportations that we want.

During the exportation, in the select file panel, pressing right click, you will be able to choose the option “Temporal layer path”. This will generate a formula that will save the layer in a unique temporal path. This is very useful for a quick exportations where you don’t worry about the path. If later you want to save the layer, you can repeat the exportation but choose a no temporal file path.
The exportation process also has a new Attribute selection panel. You will be able to change field name, choose if you want to export them, change its type or size.
Saving and loading labelling
Any GIS user knows that sometimes it can take a considerable time to define the characteristics of a labelling; a labelling configuration that can’t be recovered for other projects. And sometimes we may be interested in applying different types of labelling in a same project to the same layer.
This type of needs are covered with this new functionality that allows to save labelling configuration and recovering it whenever we need it.
 More info: https://blog.gvsig.org/2019/02/13/towards-gvsig-2-5-saving-and-loading-labelling/
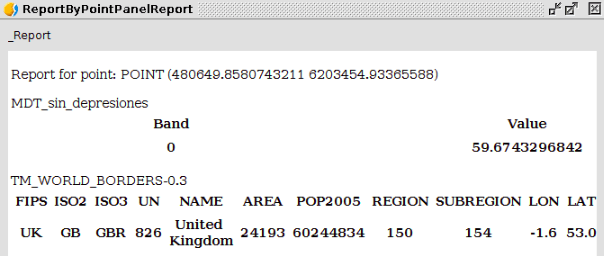
Report by point
The operation is very simple, you only have to click on a specific point on the View and a report will be shown in a new window on that point with all the attributes of all visible layers. In that report you can select and copy data to the clipboard, being able to paste them in other applications.
In addition, a new tab has been added to the layer “Properties”, that allows to define which fields you want to see in the report, and even you can modify the field name to be shown.
More info: https://blog.gvsig.org/2019/02/15/towards-gvsig-2-5-report-by-point/
Integration with Jaspersoft for Reports
Jaspersoft is an open source tool for the creation of reports. It’s very powerful and widespread use. In this tool you can create a report template that later will be fill by gvSIG.
Jaspersoft includes some default template but we can create a new ones from cero.
We have created an integration with this software. gvSIG Desktop will be use as a server of alphanumeric data and for maps images for our designed reports.

More info: https://blog.gvsig.org/2019/11/05/towards-gvsig-2-5-integration-with-jaspersoft-for-reports/
Topology framework
The topology term refers to the spatial relationships between the different entities of a GIS. These special relationships turn into a set of rules (topological rules) that we can apply to our data. The topological rules that can be applied depend mainly on the types of data that we have. There are rules that are applied to polygon layers, point layers, line layers, to the relationship between a polygon layer and a point layer, etc.
With this topology framework, gvSIG Desktop possibilities to edit and manage cartographic information are greatly increased.
More info: https://blog.gvsig.org/2019/02/12/towards-gvsig-2-5-topology/
New rules for the Topology Framework
The developed rules are:
- Must be coincident with
- Must be covered by endpoint of
- Points must be covered by line
- Must be properly inside polygons
- Contains a point
- Must be disjoint
- Must not have dangles
- Must be larger than cluster tolerance

More info:
https://blog.gvsig.org/2019/11/04/gsoc-project-2019-new-rules-for-the-topology-framework-1/
https://blog.gvsig.org/2019/10/19/9610/
Project backup
Many of the gvSIG Desktop users usually work saving their projects. These projects, for different reasons, may have errors and they are not saved or loaded correctly. To avoid this as much as possible, gvSIG Desktop 2.5 will automatically create backup of our projects.
Its operating way is very simple. Every time we save a project in a satisfactory way, gvSIG will create a copy of the same project join together with the original one with the same name but with different extension (.bak).

In case we have an error when saving a project, gvSIG will load the last backup of that project when detecting the error, and it will modify its name indicating the date on which the error was happened, marking that backup as the last valid copy of that project.
More info: https://blog.gvsig.org/2019/05/28/towards-gvsig-2-5-project-backup/
Fields importer
Thanks to it you can import the fields that you want from one table to another, through a field that allows to establish a relationship.
This tool allows you to optimize this type of tasks, which otherwise would have to be done by establishing a series of steps: creating a link, exporting to new layer, editing the table if we want to make changes in the configuration of fields … With the fields importer all these actions are reduced to the use of a single tool, where you can define the fields to be imported and even define how to name them once imported. This is another extremely useful novelty.
More info: https://blog.gvsig.org/2019/02/25/towards-gvsig-2-5-fields-importer/
New Search tool
The new version of gvSIG Desktop 2.5 has a new interesting tool to explore and visualize our data and this is the Search tool.
The tool has two main parts:
-
Upper part: use it to create filters for our data. It has the simple and advanced search. The simple search can be used just by clicking in the components. The advanced search is ready to use an expression on it.
-
Lower part: for visualization purposes of the filtered data in a table. It also contains new tools to execute over the filtered data.
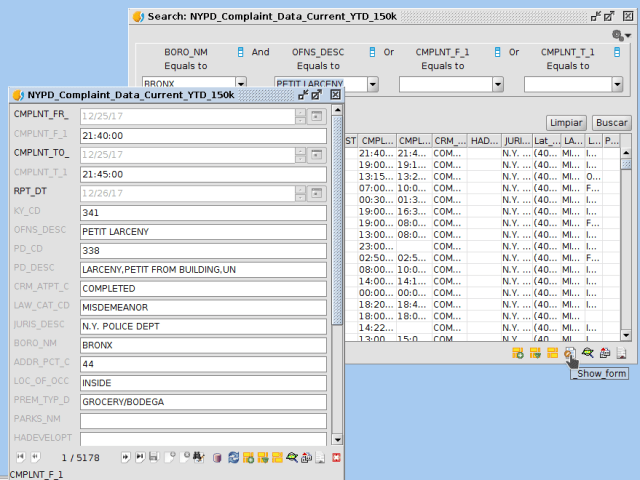
This tool has another associated tools. We can create an elaborate seleccion adding values to the existing selection o creating a new one. We can make a zoom to the filter. We also can use this filter in the exportation process framework or use this filter using the gvSIG forms.
More info: https://blog.gvsig.org/2019/11/05/towards-gvsig-2-5-new-search-tool/
Virtual fields
This fields contain values that are calculated when executing a certain formula that the user has defined. And, therefore, their values are automatically updated each time there is a change that affects that formula.
More info: https://blog.gvsig.org/2019/02/11/towards-gvsig-2-5-virtual-fields/
Expressions
An expression is a formula used for calculations. For example, if we want to create a selection or calculate new values, those can be done by an expression.
We have created a window to create these expressions and you will find it in different places in gvSIG Desktop. This windows could present modifications depending of the purpose of the tool in that moment.

We have introduce support for simple and really advanced calculations using this expressions. Now it will be possible to operate between different types of fields (text, numbers, dates..), new type of classes more common in programming (color, images,…) and very important, calculations with geometries, to get information (get vertex, perimeter, area,..) or to create/modify the geometry (buffer,…)
And the power of the expressions doesn’t end there, it can be use for more powerful calculations. In this operations can be use different layers, we can create joins between tables or introduce programming code directly in the expression and much more.
Also, we can access easily to others parts of gvSIG. For example, we can access to point saved in the plugin “Coordinate Capture” to create expressions with this points.
More info: https://blog.gvsig.org/2019/05/08/towards-gvsig-2-5-expressions/
New Column Manager
For the new gvSIG 2.5 version several parts have had to be redone to take advantage of the full potential of the gvSIG novelties right now. One of these parts that we have redone is the Column Manager.
The Column Manager is used for managing the layer scheme. We can add new fields, modify or delete them, as well as consult the characteristics associated with these fields.

In the previous version, to modify characteristics of a field it was necessary to delete it and create it again. This will no longer be necessary. It will greatly facilitate the creation of complicated schemes because of being everything at the same window where it will be possible to add, modify and delete what we need.
The advantage of this new manager, is that there are a lot of advanced options also integrated into it. For certain fields we can indicate several options such as not allowing nulls, a typical option in databases, but thanks to this new manager and other improvements made on gvSIG we can apply it in normal shapefiles.
Another example is the “Data profile” field. It is an advanced option that allows to indicate that certain fields behave like another type of data. For example, fields with ByteArray type images are embedded in some SQLite layers. If we set that we want this ByteArray field to be recognized as an image in gvSIG, it will do it at that way and it will be shown as an image in different parts of the application, such as in the forms.
We also see that it includes the option to indicate that the field is a virtual field and its value corresponds according to an expression.
In the date type fields we will see that the Time tab is enabled. In this tab it will be possible to set time ranges. These time ranges can be used to create animations of our data by time.
More info: https://blog.gvsig.org/2019/05/14/towards-gvsig-2-5-new-column-manager/
Data profiles
The data profiles will allow gvSIG to treat certain types of fields in an special way. This profiles are set in the column manager.
For example, if we have a field that it is a ByteArray type like in some data bases (the data is saved directly in the field), and we know this data is an image, we can apply an Image profile. This will allow gvSIG to work with this field as if it was an image. In the forms tool we could visualize the image instead of just a string.
In the same way, if we have a String field that contains a path to an image, absolute or relative path, we can select that this type of field is a File and the profile is an Image.

More info: https://blog.gvsig.org/2019/11/05/towards-gvsig-2-5-data-profiles/
Relationships between tables and its functionalities
One of the new functionalities of gvSIG is that you will be able to create relationships between tables through a common field or foreign key. You can configure all this new functionalities in the new Column manager.
We can create relations 1 to 1. In the field of one feature in one table you create a relation to other one feature in other table. In this example you can se how the field Conductor makes reference to other table where you see all the features related to this field.

The relations 1 to many means that for each feature in one table, a multiple features from other table are assigned to that feature. It will be a list of features.
It’s also posible to configure a list of possible values for a field. This will be a closed list.
Forms configuration
The possibility to configure forms to visualize data takes big importance when the data has a hundred of fields with abbreviate field names. This data is hard to comprehend for the user. gvSIG has the capability to visualize the data in two types of forms.

More info: https://blog.gvsig.org/2019/11/05/towards-gvsig-2-5-forms-configuration/
Geoprocessing framework
Now when opening the geoprocessing toolbox, you can see that extra information about the layers and fields appears at the interface.

At layer type parameters, you will be able to see the layer name, the name of the View in which it is, if it has an active selection and how many entities are selected. An icon will also appear indicating the type of geometry of the layer, or if it has a selection (with a background yellow circle).
At field type parameters, you can also see information about the type of field. and in the future you will be able to see an icon identifying that field.
Integration with the new plugin to capture coordinates
As we have told about gvSIG has a new expression generator. In the geoprocessing framework this functionality has been added, so that new geoprocesses can have a new type of parameter that is expression type.

More info: https://blog.gvsig.org/2019/02/21/towards-gvsig-2-5-improvements-at-geoprocessing-framework/
Select and count duplicate values in gvSIG
Two new plugins have been published for the management of duplicate values in a field of the attribute table of a vector layer.
The first plugin is an improvement of the already existing duplicate selection tool, where all the elements with duplicate values were selected in a field of the table. With the new functionality the first one won’t be selected now. With this the user has both options available.
The second plugin allows us to count different values in a field of the attribute table. This new tool is added as a geoprocess in the Toolbox, and selecting the table and the field, we would obtain a new table (available in Project Manager-> Table) with the different values of the selected field, and the number of times that each one is repeated.
More info: https://blog.gvsig.org/2018/07/03/new-plugins-to-select-and-count-duplicate-values-in-gvsig/
Aoristic Clock
The main objective of this geoprocess is to visualize the distribution of the temporal component in a graphical way. Its distribution within the hours of the same day, and within the day of the week will be shown.

More info: https://blog.gvsig.org/2019/03/13/towards-gvsig-2-5-new-geoprocess-aoristic-clock/
Aoristic Clock by grid
The main objective of this geoprocess is to visualize the distribution of the temporal component in a graphical way. Its distribution within the hours of the same day, and within the day of the week will be shown.
 More info: https://blog.gvsig.org/2019/03/14/towards-gvsig-2-5-new-geoprocess-aoristic-clock-by-grid/
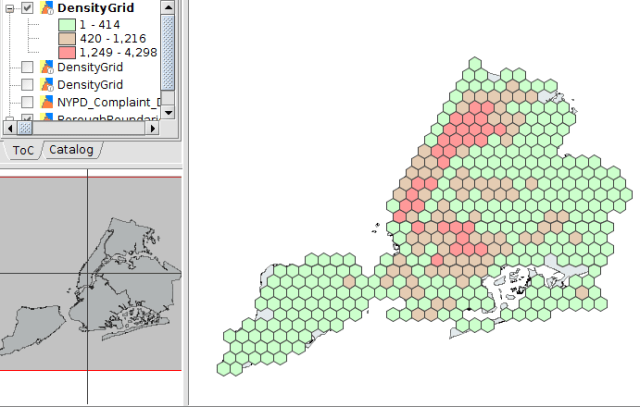
Grid by point density
The main objective of this geoprocess is to perform a fast and efficient count of points contained in a grid, that also is created by the geoprocess.
More info: https://blog.gvsig.org/2019/02/27/towards-gvsig-2-5-new-geoprocess-grid-by-point-density/
Convert a 2D vector layer to 3D from a DEM
This new functionality allows to convert a 2D vector layer into a 3D layer, taking Z coordinates from a Digital Terrain Model on the same area, and assigning them as Z coordinate to the elements of the vector layer. The vector layer has to be a shapefile (it works on points, lines and polygons).

Lateral buffer
It allows to create a buffer on one side of the selected geometries.
The Horton Machine
This plugin has a new toolbox with hundreds of different geoprocesses, added to the more than 350 geoprocesses included in gvSIG Desktop.
With The Horton Machine in gvSIG we will have new and interesting tools: geomorphology analysis (drainage direction, network and watershed extraction, rescaled distances and hydrologic attributes, slope, curvatures, hydrologic indexes, geomorphologic attributes, statistics, peakflow, Saint Venant, tools to prepare data for HECRAS, Shalstab, debrisflow…), LESTO (LiDAR Empowered Sciences Toolbox Opensource), raster map calculator, mobile tools…

More info: https://blog.gvsig.org/2018/03/15/the-horton-machine-new-geoprocesses-available-for-gvsig-2-4/
Taxonomy symbol library
In biology, taxonomy is the science of naming, defining (circumscribing) and classifying groups of biological organisms on the basis of shared characteristics.. The new symbol library includes more than 200 icons of species.

More info: https://blog.gvsig.org/2019/11/04/towards-gvsig-2-5-taxonomy-symbol-library/
“Indigenous mapping” symbol library
We added a new symbol library called “Indigenous mapping” that contains an interesting set of point symbols developed by “The Ethnographic Mapping Lab” of the University of Victoria and designed by the graphic artist James Gray.
The objective of these icons is to represent the set of activities, resources and locations commonly associated with indigenous mapping projects.

More info: https://blog.gvsig.org/2019/02/13/towards-gvsig-2-5-indigenous-mapping-symbol-library/
gvSIG Black: New icon set
A new icon theme ready to be used in the application, that you can already find in the add-ons manager. The name of this plugin is ‘gvSIG Black‘ and the icon resolution is 24×24 pixels.
![]()
Icons scale
The option to scale the icons has been included at gvSIG preferences, independetly of the icons set that we are using.
New OSM map servers
Now we have added three new servers to the great number of OSM servers that were already available in gvSIG, that we think that will be interesting for certain uses:
- OSM France. Oriented to show the OSM data with the toponymy in French and the most representative symbols of French culture (for example, bakeries are represented with the symbol of a baguette). Surely it will be useful for the growing French-speaking gvSIG Desktop users community.
- Hillshading. It shows the relief of the ground through a representation using grey tones.
- OSM B&W. In this case it shows the OSM cartography, as represented by Mapnik, but without using colours, only using grey tones.
More info: https://blog.gvsig.org/2019/02/28/towards-gvsig-2-5-new-osm-map-servers/
gvSIG Desktop and gvSIG Mobile integration
This plugin includes a new functionality that allows to generate the base cartography for gvSIG Mobile from a gvSIG Desktop View. In addition, we will be able to load a project made in gvSIG Mobile directly in gvSIG Desktop, including the elements created with a customized form, images, etc.

More information: https://blog.gvsig.org/2018/03/20/plugin-for-gvsig-desktop-and-gvsig-mobile-integration-is-now-available/
Create forms for field data gathering with gvSIG Mobile
Through this plugin we can create custom forms for censuses, surveys, inventories, inspections …, with the different type of fields that we want (drop-down, multi-selection, date, true-false …).
The main advantage of working with these forms is that we can create different sections, which cover different topics, and each of them with their customized forms.

Analysis of drinking water distribution systems
Plugin to connect with the software called “Epanet”, that allows the analysis of drinking water distribution systems.

Images on SpatialLite
Spatialite images support. It allows to be consulted from forms, its use from hyperlink and export images to folders.
Statistics Viewer
The statistical process are oriented to error detection in the alphanumeric values. This errors are difficult to find if there are no specified tools for it. Also, they will help us to learn about the meaning of our data.

More info: https://blog.gvsig.org/2018/03/01/new-plugin-for-gvsig-2-4-statistics-viewer/


A lots of interesting and usefull features, great work, congratulations to all developers of the new features and software at all
Thank you! We hope that you enjoy it.
Pingback: @gvSIG Desktop 2.5 released – GeoNe.ws
when will be ready the version for MAC?
Hi Marcella, there’s a gvSIG 2.4 version for Mac (similar to gvSIG 2.5 but without the novelties of this post), where there are 2 distributions: one released by gvSIG Association and the other one by the gvSIG Community. You can find them here: http://www.gvsig.com/en/products/gvsig-desktop/previous-versions/-/asset_publisher/5XeNC4TyL8zK/content/gvsig-2-4
We noted that some users had problems to work on Mac, and we are trying to have a more stable version later. Some Mac users are working on a virtual machine with Ubuntu and they are working without any problem.
We hope to have that Mac version soon.
Best regards,
Mario Carrera