Evaluando la calidad de tramas urbanas (II)

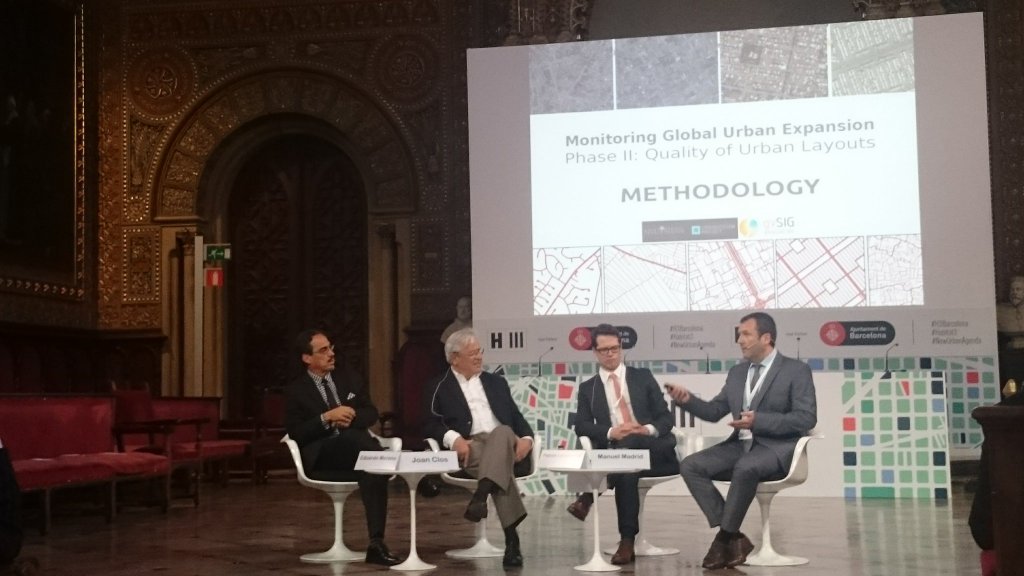
Tal y como anunciamos en un anterior post, vamos a describir los fundamentos de la metodología desarrollada conjuntamente por la Asociación gvSIG y la Universidad de Nueva York (NYU) en el marco del proyecto “Monitoring Global Urban Expansion”, para la evaluación de la calidad de tramas urbanas.

Métricas

El objetivo de la metodología es la medición de las siguientes características:

  • Áreas y porcentajes ocupados por los distintos usos de suelo.
  • Proporción de espacio dedicado a calle.
  • Distribución de anchos de calle.
  • Tamaño medio de bloque.
  • Densidad de Intersecciones.
  • Facilidad para desplazarse a pie.
  • Tamaño típico de parcelas.
  • Acceso a vías arteriales.

Todas estas características se obtuvieron a partir de cartografía vectorial con la ayuda de algoritmos de geoprocesamiento. El primer paso, por tanto, fue el de generar la cartografía necesaria. Para ello se utilizó la herramienta libre de mapeo del proyecto OpenStreetMap, JOSM y como principales fuentes de datos se utilizaron imágenes satélite de Bing y Mapbox.

Muestreo

Dado que digitalizar las ciudades en toda su extensión hubiera sido demasiado costoso se planteó la utilización de técnicas de muestreo. Para la generación de las muestras se utilizó una secuencia semialeatoria Halton, la cual tiene la ventaja sobre secuencias aleatorias puras de que tiene una mejor cobertura espacial sin dejar de ser aleatoria, lo que es muy importante desde el punto de vista estadístico.

Selection_608Sobre cada uno de los puntos de la secuencia que caen dentro de la zona de estudio se generó un círculo con una superficie de 10 hectareas, al cual llamamos locale, sobre los cuales se centra el análisis. Cabe destacar que cada locale tiene un identificador único para todo el planeta con la idea de que sirvan de base para posteriores estudios.

En función del tamaño del área de estudio se utilizaron dos densidades de muestras distintas: para áreas de estudio menores de 25Km2 se generaron 4 muestras por Km2 mientras que para áreas mayores la densidad de las muestras fue de una por Km2.

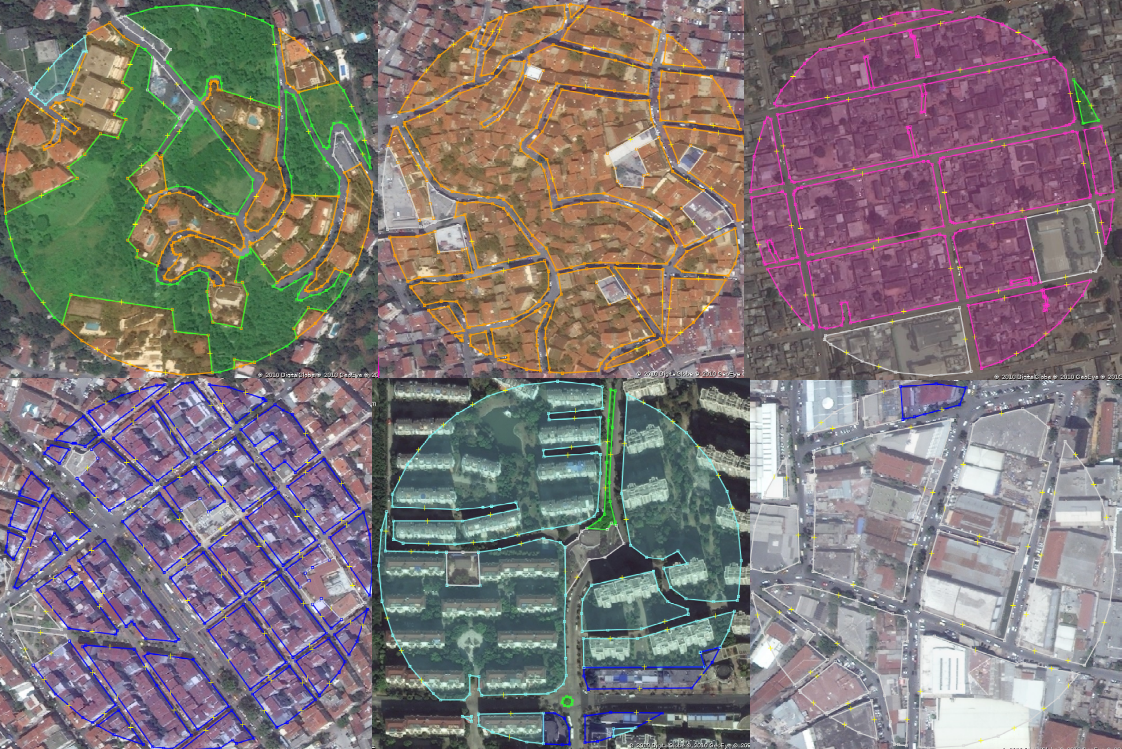
Clasificación de Usos del Suelo

Previamente a la digitalización se estableció la clasificación de usos del suelo, la cual incluyó las siguientes categorías:

  1. Open Space. Se refiere en general a cualquier área no construida. En particular incluye:
    – Campo abierto.
    – Bosques.
    – Campos de cultivo.
    – Parques.
    – Masas de agua.
  2. Non-Residential. Incluye áreas construidas de uso no residencial como por ejemplo:
    – Zonas industriales.
    – Estaciones de tren y autobús.
    – Aeropuertos.
    – Escuelas, institutos y universidades.
    – Centros comerciales.
  3. Residential. Para las áreas residenciales se establecieron 4 subcategorías en función de su estado de evolución y considerando los siguientes factores principales: homogeneidad de las estructuras, regularidad de la red de calles y calidad de las infraestructuras.
    1. Atomistic: áreas que se desarrollaron sin planeamiento previo.
    2. Informal Land Subdivision: áreas planificadas pero con una infraestructura deficiente (falta de aceras y asfalto principalmente).
    3. Formal Land Subdivision: similar a la anterior pero con infraestructura completa.
    4. Housing Project: áreas donde las estructuras son homogéneas a causa de que fueron desarrolladas en base a un mismo proyecto. Puede incluir desde torres de apartamentos a urbanizaciones masivas de viviendas unifamiliares.

Digitalización

Para cada una de las muestras se digitalizaron los siguientes elementos:

  • Locale Boundary. Es el círculo en sí mismo excepto cuando se da un solape entre círculos, en cuyo caso el segundo círculo según el orden de la secuencia se recorta. De este elemento se obtiene la superficie total del locale.
  • Blocks. Contorno de todos los bloques que caen dentro del locale, separando así el espacio calle del espacio bloque. Además se identificaron los usos del suelo de todos los bloques y se etiquetaron de acuerdo con su categoría.Selection_626
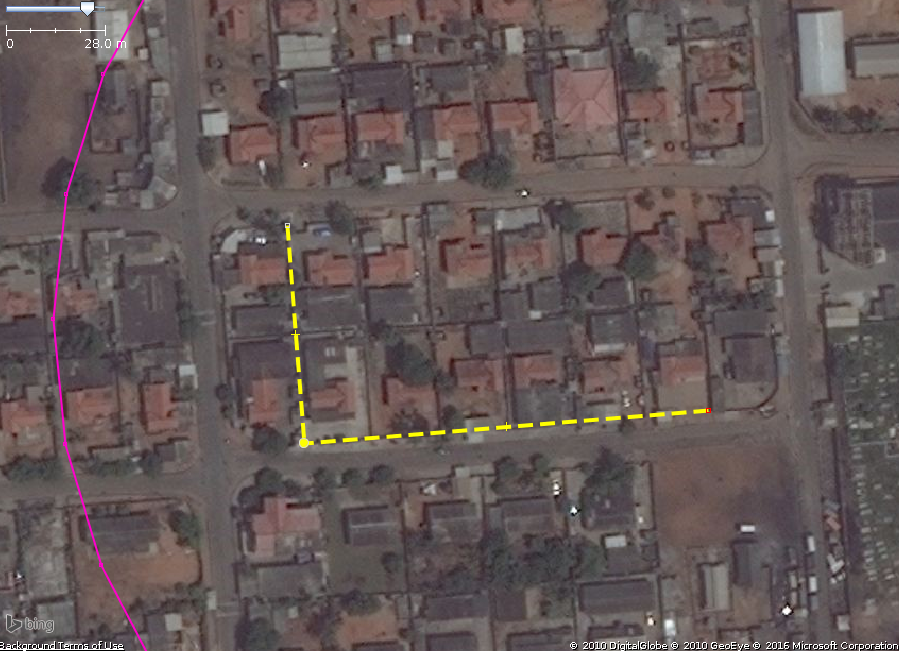
  • Plot Measurements. En aquellos bloques en los que se podía identificar claramente el tamaño de las parcelas y este era regular se tomaron mediciones de anchos y profundidades de las parcelas. Este elemento solo se generó en aquellos locales que contenían bloques de tipo Residential – Informal Subdivision y Residential – Formal Subdivision.Selection_616
  • Road Medians. Ejes de calle alrededor de todos los bloques que intersecan con la locale boundary o están completamente incluidos en ella.Selection_630

Representatividad de la muestra

Para garantizar la representatividad de las muestras se procedió de la siguiente forma: se digitalizó un conjunto inicial de 40 locales; posteriormente se calcularon las métricas, los valores medios y, mediante un test estadístico diseñado a tal efecto, sus respectivos niveles de confianza; mientras no se alcanzó un alto grado de confianza en las principales métricas, se continuó digitalizando locales.

Digitalización de las Vías Arteriales

En paralelo a la digitalización de los locales se llevó a cabo la digitalización de todas las vías arteriales de cada ciudad, es decir, todas aquellas vías de más de 18m de ancho que están conectadas entre sí.Selection_628

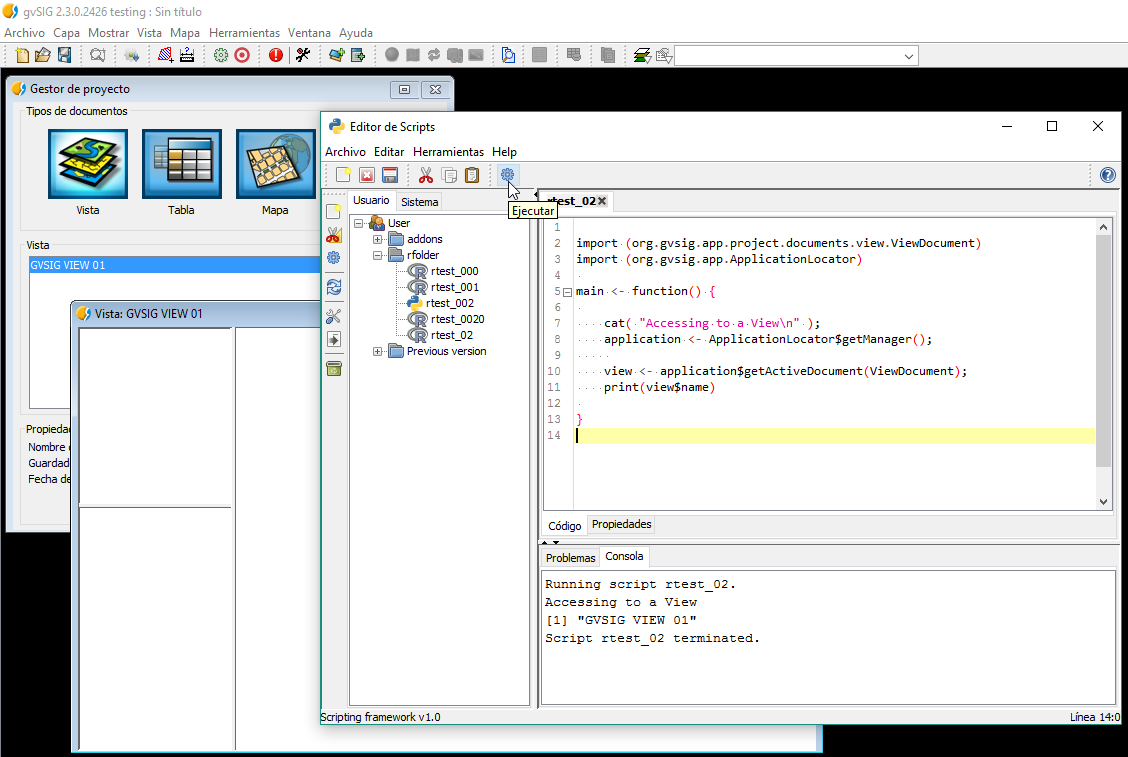
Obtención de las métricas

Una vez digitalizados todos los elementos necesarios se procedió a calcular las métricas mediante dos algoritmos programados en Python.

Posted in gvSIG Desktop, spanish, technical collaborations | Tagged , , , | 2 Comments

Assessing the quality of urban layouts (I)

mosaicoFactors like a right proportion of public spaces and a good connectivity are crucial for the economic, social and cultural development of cities as they facilitates citizen mobility and interaction. This is well known among urban experts but, to which extent are these and other urban layout quality related aspects decisive?

New York University (NYU), Lincoln Institute of Land Policy and UN-Habitat launched in 2014 a research project called “Monitoring Global Urban Expansion” which main objective was to assess the quality of the urban layouts in 200 cities around the world as a representative sample of the universe of 4,231 cities that had at least 100,000 people in 2010, in order to be able to measure the correlation between the quality of urban layouts and some socioeconomic indicators. This study also will allow us to know about the historical evolution of urban layouts as well as about its spatial distribution over the world.

The assessment of the quality of the urban layouts was carried out through measuring the following features:

  • Land Use Areas and Shares
  • Proportion of Street Space
  • Street Widhts
  • Block Size
  • Intersection Density
  • Walkability
  • Plot Dimensions
  • Access to Arterial Roads

Preliminary results and conclusions of this ambitious study were presented on April 4th in the Habitat III Thematic Meeting – Public Spaces held in Barcelona. One of the most remarkable conclusions that we can get from the current data is the gradual decrease of the quality of urban layouts during the last 30 years. The figures confirm a lower presence of planned areas as well as a increase in the average block size. Taking into account that most cities in developed countries are expected to double its population and triple its area, if this tendencyCfMj9nRWIAAb3FC_large is not reversed the consequences for their inhabitants may be terrible. The good news, however, is that we can still reverse the tendency and this is the final objective of this study: to be used as a tool for the definition of adequate urban policies that allow cities to expand in an organized way.

The mentioned conference held in Barcelona is a milestone in the way to Habitat III world conference that this year will be held in Quito (Ecuador) in October. It will be the third edition of a conference that is held every 20 years (former editions were held in 1976 and 1996) and that is the biggest urban experts meeting in the world.

The methodology for measuring the mentioned features has been developed by the gvSIG Association and the New York University (NYU). In a further post we’ll describe the basis of this methodology.

Posted in english, gvSIG Desktop, press office, technical collaborations | Tagged , | Leave a comment

Smart cities: technical decisions, political decisions

chess

We want to close the posts related to Smart Cities and to the unbreakable relation between Smart Cities and open source software, with a question not many times taken into account and many times ignored. Talking about software, which part should be a political decision and which part should be a technical one?.

Before carrying on, if you have not read the previous posts, you should do it. You will find how the main reasons are argued to explain why the arguments for the main reasons for why one Smart City must necessarily have its information systems (geographic and any other type) based on open source technologies.

Because it is the only guarantee for the technological independence.

Because it reduces asymmetries and the digital gap between cities.

Because it eases the reuse of solutions, the joining force.

Today, we find that despite of the logic of the arguments and the supporting laws, in the projects related to the Smart Cities, outrageous amount of public money is spent in the acquisition of licences. Who is responsible for this? The technician or the politician? Who should define the terms in contracting these tools for managing the public services?

Our experience is that the regulation is defined by the technical department. A group of civil servants who work in a technical area, define the functional requirements and also, trained in the university and used to work with some branches…indicating that the services should include some software licences. This situation makes that or the technician has knowledge of the harmful impact of implementing privative software in the institutions and with a sense of responsibility to avoid them…or we will have another case of technological dependence of one institution.

And the politician? Well, sadly, in the 99% of the cases they have not interest in software, technology, do not matter! That is, It doesn´t seem important. In so many cases, there is also some lack of communication between politics and technology

Let´s imagine that a new infrastructure is need to be done, one highway, one road, one park, one school, one hospital….choose any of them.

Which will be the technical decisions? The type of asphalt, the election of tress, etc…Anybody can imagine that the road was public or with a toll, if the road was for public use or not, that the school was private or public?…the decisions to take about the use of any infrastructure are political decisions. Why with the technological infrastructure doesn’t happen the same?

These analogies are to determine that the use of open source software should be always a decision political and not technical.

We hope that these posts have been of your interest and they will serve to open a necessary debate. From the gvSIG Association offer our experience and knowledge to bet on Smart Cities and free solutions.

We need smart cities, but being technologically free

Posted in english, opinion | Tagged , | Leave a comment

Evaluando la calidad de tramas urbanas (I)

mosaico

Factores como una adecuada proporción de espacios públicos y una buena conectividad son cruciales para el desarrollo económico, social y cultural de las ciudades ya que favorecen la movilidad y la interacción entre sus habitantes. Esto es algo que se da por hecho entre los expertos en urbanismo pero ¿hasta qué punto son determinantes estos y otros aspectos relacionados con las tramas urbanas?

La Universidad de Nueva York (NYU), el Lincoln Institute of Land Policy y ONU-Habitat, pusieron en marcha en 2014 un proyecto de investigación llamado “Monitoring Global Urban Expansion” con el objetivo principal de evaluar la calidad de las tramas urbanas de 200 ciudades de todo el mundo como muestra representativa de las 4.231 ciudades que en 2010 tenían más de 100.000 habitantes, para posteriormente poder medir el grado de correlación entre la calidad de las tramas de las ciudades y diferentes indicadores socioeconómicos. El estudio también permitirá sacar conclusiones sobre la evolución histórica de las tramas urbanas así como sobre la distribución espacial de las mismas en el mundo.

La evaluación de la calidad de las tramas se ha realizado mediante la medición de los siguientes aspectos:

  • Áreas y porcentajes de los distintos usos de suelo.
  • Proporción de espacio dedicado a calle.
  • Distribución de anchos de calle.
  • Tamaño medio de bloque.
  • Densidad de Intersecciones.
  • Facilidad para desplazarse a pie.
  • Tamaño típico de parcelas.
  • Acceso a vías arteriales.

Los resultados y conclusiones preliminares de este ambicioso estudio fueron presentados el pasado lunes 4 de abril en el congreso Habitat III Thematic Meeting – Public Spaces celebrado en Barcelona. Una de las conclusiones que pueden extraerse de los datos obtenidos hasta el momento y que merece resaltarse es el descenso paulatino en la calidad de las tramas urbanas a lo laCfMj9nRWIAAb3FC_largergo de los últimos 30 años. Los números constatan una menor presencia de áreas planificadas así como un aumento del tamaño de los bloques. Teniendo en cuenta que se espera que en los próximos 30 años muchas de las ciudades de los paises en desarrollo vean duplicada su población y triplicada su superficie, si no se revierte la actual tendencia las consecuencias para los habitantes de estas ciudades pueden ser nefastas. La buena noticia es que todavía estamos a tiempo de revertir esta tendencia y este es precisamente el último objetivo del estudio: servir de herramienta para la definición de políticas de urbanismo adecuadas que permitan un crecimiento ordenado de las ciudades.

El mencionado congreso celebrado en Barcelona sirve de antesala al congreso mundial Habitat III que este año tendrá lugar en Quito (Ecuador) en octubre, en el que se presentarán las conclusiones definitivas del estudio. Será la tercera edición de un congreso que se celebra cada 20 años (las anteriores ediciones fueron en 1976 y en 1996) y que es la mayor reunión de expertos en urbanismo del mundo.

La metodología para la medición de las características mencionadas más arriba, que también fue presentada el pasado 4 de abril en Barcelona, ha sido desarrollada de forma conjunta por la Asociación gvSIG y la Universidad de Nueva York (NYU). En un siguiente post describiremos los fundamentos de esta metodología.

Posted in press office, spanish, technical collaborations | Tagged , , , | 7 Comments

Splitting strings in an attribute table on gvSIG 2.x

When we work with an attribute table in gvSIG, we sometimes want to split the strings in one of the fields, in order to have a substring. For that, we would use the subString operator at the Field calculator, that will return a part of the original string.

For example, if we have an only field with the code of a municipality (two numbers), then a space, and finally the name of the municipality, we would be able to be interested in having a new field with the code, and another one with the name. The subString operator will allow to do it.

The subString command has the following structure:

subString(Parameter 1,Parameter 2, Parameter 3)

where:

  • Parameter 1: It is the field name (between square brackets in gvSIG).
  • Parameter 2: It is the position of the first character to be split.
  • Parameter 3: It is the position of the last character of the substring to be split.

And we have to take into account that the first position will be “0”.

In addition, the Length operator can be used when we want to split the last characters and the length of the different strings in the field is different.

Substring_en

We can have several possible situations, and these options are the most common ones:

  • We want to take the initial part of the string, removing the last X characters:

subString([Field],0,length([Field])-X)

(where “Field” will be the field name, and X will be the number of characters of the end to be removed)

Example: Removing the last 3 characters: subString([Field],0,length([Field])-3)

  • We want to remove the first X characters, and take the rest of the string:

subString([Field],X,length([Field]))

(where “Field” will be the field name, and X will be the number of characters to be removed at the beginning of the string)

Example: Removing the first 3 characters: subString([Field],3,length([Field]))

  • We want to take only the first X characters:

subString([Field],0,X-1)

(where “Field” will be the field name, y “X-1” and “X-1” will be the numbers of characters to be taken)

Example: Taking the first 3 characters: subString([Field],0,2)

  • We want to take only the last X characters:

subString([Field],length([Field])-X,length([Field]))

(where “Field” will be the field name, and X will be the number of characters that we want to take at the end of the string)

Example: Taking only the last 3 characters: subString([Field],length([Field])-3,length([Field]))

Here you have a video about it:

We hope that this functionality is useful for you!

Posted in english, gvSIG Desktop, training | Leave a comment

Recortar cadenas en una tabla de atributos en gvSIG 2.x

Cuando trabajamos con una tabla de atributos en gvSIG, en ocasiones queremos recortar las cadenas de uno de los campos de tipo texto, de forma que nos quede una subcadena. Para ello se utilizaría el operador subString de la Calculadora de campos, que devolverá parte de la cadena original.

Un ejemplo de uso podría ser, si tuviésemos un único campo que contiene primero el código de dos cifras de un municipio, después un espacio, y al final el nombre del municipio, y en el que podría interesarnos tener un campo aparte que contenga solo el código del municipio, y otro campo distinto que tenga el nombre del mismo. El comando subString nos permite hacerlo.

El comando subString tiene la siguiente estructura:

subString(Parámetro 1,Parámetro 2, Parámetro 3)

donde:

  • Parámetro 1: Es el nombre del campo (entre corchetes en gvSIG).
  • Parámetro 2: Es la posición del primer carácter de la subcadena que queremos recortar.
  • Parámetro 3: Es la posición del último carácter de la subcadena que queremos recortar.

teniendo en cuenta que la primera posición es la posición “0”.

Aparte, se puede utilizar el operador “Length” por ejemplo si queremos recortar los últimos caracteres y los valores del campo a recortar tienen longitudes distintas.

Substring_es

Se pueden plantear varias situaciones posibles, siendo estas las más comunes:

  • Quedarnos con la parte inicial de la cadena, eliminando los últimos X caracteres:

subString([Field],0,length([Field])-X)

(donde “Field” será el nombre del campo a recortar, y X los caracteres a eliminar del final)

Ejemplo: Eliminar los últimos 3 caracteres: subString([Field],0,length([Field])-3)

  • Eliminar los primeros X caracteres y quedarnos con el resto de la cadena:

subString([Field],X,length([Field]))

(donde “Field” será el nombre del campo a recortar, y X los caracteres a eliminar del principio)

Ejemplo: Eliminar los primeros 3 caracteres: subString([Field],3,length([Field]))

  • Quedarnos solo con los primeros X caracteres:

subString([Field],0,X-1)

(donde “Field” será el nombre del campo a recortar, y “X-1” los caracteres con los que queremos quedarnos)

Ejemplo: Quedarnos con los 3 primeros caracteres: subString([Field],0,2)

  • Quedarnos solo con los últimos X caracteres:

subString([Field],length([Field])-X,length([Field]))

(donde “Field” será el nombre del campo a recortar, y X los caracteres con los que nos quedamos del final)

Ejemplo: Quedarnos solo con los últimos 3 caracteres: subString([Field],length([Field])-3,length([Field]))

Aquí tenéis un vídeo de ejemplo:

¡Esperamos que os sea útil esta funcionalidad!

Posted in gvSIG Desktop, spanish, training | Leave a comment

Tutorial “Kurzanleitung für die Erstellung von Fundverteilungskarten mit gvSIG 2.2“

Ein weiteres Tutorial für gvSIG 2.2 ist nun in Deutsch verfügbar.

Tutorial_german_3Mit gvSIG 2.2 können mühelos archäologische Fundkarten erstellt werden. Mit dieser Schritt-für-Schritt Anleitung soll der unerfahrene GIS-Benutzer eine Einführung in den Umgang mit diesem Programm erhalten. Von der Einstellung bis zum Kartenexport wird jeder Arbeitsprozess einzeln erklärt, mit einer kurzen Beschreibung versehen und einem screenshot illustriert. Daneben gibt es allgemeine Informationen über Koordiantensysteme und Projektionen der Erdoberfläche.

Tutorial_german_1Die Einleitung ist in deutscher Sprache geschrieben. Aufbau und Menüstruktur von gvSIG 2.2 sind aber unabhängig von der gewählten Sprache, so können mit Hilfe der zahlreichen screenshots Sprachbarrieren überwunden werden.

Ich denke, es ist hilfreich für Euch!


Dr. phil. Ulrich Werz M.A.

Fundmünzbearbeitung
Archäologiepark Villa Borg
Im Meeswald 1
66706 Perl-Borg
Posted in german, gvSIG Association, gvSIG Desktop, gvSIG Educa | Leave a comment

Smart cities: what about the reuse?

imagen proyectosAt this point in our live we still get indignant about seeing tenders and public grants and most of them related to Smart Cities in the last years where basically citizens money is spent in software licenses acquisition. Licenses with names and surnames in a high percentage of cases.

At the series of posts that we started about Smart Cities and open source software we dealt with the reasons why a city only can be intelligent if it guarantees the technological independence of its information systems and why the proprietary software deepens in the technological discrimination between first and second class cities.

Today, we would like to focus on a subject that however, being in all the basic manuals of the government, it seems that when it concerns to the software area, many times is forgotten and relegated to something insignificant. wet paper. As much as this area has a legislative character.

And if, the topic is the reuse. Subject that tells us that our public managers must focus on solutions to be shared, reused, that they can be improved and supplemented between administrations. In computing solutions this is only possible with open source software licenses.

In one previous post, we talked about that for the vast majority of cities the only option to get into the modernization of the public management was the open source software, now we should think about the savings and the technological advance which will be created if the solutions were shared. If it would be a collaboration in the evolution, if the efforts would be added…

The needs of the cities are, basically, the same ones in any part of the world. Infrastructure management (sewage and water management, lighting,…), heritage, town inventory, waste management, town planning,…the software solutions, therefore, could have one similar technological base. And if all the data are geolocated, the geomatics, the GIS are a fundamental key in the Smart Cities framework. We talk from the practice and the experience of the gvSIG Association, knowing that the 100% of all the geomatics needs of any town can be solved with total guarantee for the open source software..

And with the weight of the logic of reusing, the actual legislation must be added, which is equivalent in all countries. Let´s see the case of Spain.

The (ENI), governed by Royal Decree 4 / 2010 of 8 January, establishes the set of criteria and recommendations which should be taken into account by supplied by public administrations for decision-making to guarantee interoperability. ENI is aligned with the European Strategy for interoperability and Interoperability European Framework. Both the ENI, and their interoperability technical standards, provide for systematic liaison with equivalent instruments the European area.

And what says about reusing? The article 16 says:

The licensing conditions of the applications and associated documentation, and any other information objects which public authorities are holders of intellectual property rights and that they can make available to other public administrations and citizens, without nothing in return or any agreement, they will take into account that the aim pursued is the use and reuse, as well as the protection against any misappropriation exclusively by third parties .

Indicates that the Administrations should take into account the available solutions for free reuse, that can satisfy (all or part) of the needs of the new systems and services or improving and updating those already implemented.

And concludes that: the main aim of the release of assets is the possible Reuse of the same ones by other stakeholders. Organizations, particularly, public governments, dedicate efforts to create assets that may already exist . The reuse of these assets can allow the sharing of resources and results , on the one hand, within government and including contributing to save resources, effort and time , and, on the other hand, society, contributing to social and economic interest.

Great laws, aren´t they? And now, are we going to take them seriously? To bet for the reusing is to bet for the free technologies. Technological sovereignty, reduction of asymmetries and reuse.

We must ask for smart managers to have smart cities.

Posted in english, opinion | Tagged , , | 2 Comments

Smart Cities: Can only the big cities be intelligent?

livingcities_peq

Some days ago we talked about that it’s not possible to apply the Smart City concept, the intelligent city concept, to that cities where their public managers apply policies and projects that make their technological infrastructures, their information systems, are dependent on sole providers. Unfortunately it happens frequently and it jeopardizes the technological future of the cities.

Stressing in that issue about the Smart Cities there’s another aspect that we would like to stand out related to the proprietary software opposite to open source solutions. That’s the direct relationship between the proprietary products implementation and the generation of technological inequality between towns in a different economical level.

Everybody consider that license expenses for implementing and maintaining a geomatics platform that allows to manage geographic information is only accessible for a few city councils. A minimum percentage of the total of municipalities of any country.

Using proprietary software we are pushing most of the towns of a country into the background. This discrimination of the modernization of the city councils management causes that there’s only a few modernity examples, enough to fill in some newspaper headlines. It also causes that we condemn the rest to a digital exclusion. It doesn’t seem to be the “most smart” and more intelligent policies.

If the digital opening is mainly referring to the possibilities to convert the circulating information into relevant knowledge, betting on free solutions, based on shared knowledge, without license expenses and access limitations, is the only possibility for all the cities and towns in a country to apply the technology in order to improve their management.

And everything without entering in the own dynamics of the open source software, where the possibilities to collaborate between different municipalities are open to deal with joint developments that can be shared without any limitations.

And an intelligent country won’t be these one that has first and second class cities, intelligent and “not as much intelligent”, but the country who bets on an equality in technological opportunities for all the municipalities, and besides allows them to share and improve in a joint way.

Posted in english, opinion | 2 Comments

Running R source code from gvSIG 2.3 through Renjin

One of the new features included in gvSIG 2.3, that was commented at the 11th International gvSIG Conference (there’s also a question from an attendee at the end of the video), is the possibility to run R source code from the Scripting module. To run these R scripts, the Renjin library will be used. We’re going to tell about how to do it.

Renjin is an R interpreter made on Java, but it’s not exactly the native R that we know. It allows us to run code on R and work with all the gvSIG API on Java at the same time. This library has several benefits since it’s completely built-up in gvSIG because it supports Java libraries, but it also have some limitations. One of them is that not all the R libraries are available to be used with Renjin.

“Using Rejin, we have a great integration with gvSIG, but less integration with R”

You can find more information about Renjin in their website, as well as the R libraries, that are available to be used. Renjin is actively in development, so that we hope that there are improvements in the future, about compatibility as well as in functionalities.

We are going to show you a pair of examples. We have to open gvSIG and go to Tools – Scripting – Scripting Composer, and here we create a new Script (an R script).

We can try to run some typical R source code like this:

main <- function() {
cat( "Hello\n" );
cat( "Hello\n" );
d1 <- c(1,3,5);

x <- sample(c("A", "B", "C"), size = 10, replace = TRUE)
print(as.factor(x))

df <- data.frame(x = seq(5), y = runif(5))
print(df)
}

that will show this text by console:

Running script rtest_000.
Hello
Hello
[1] B A B B A C B A A C
Levels: A B C
x y
1 1 0,869
2 2 0,85
3 3 0,255
4 4 0,497
5 5 0,549
Script rtest_000 terminated.

At the following example we are going to show how a Java class can be imported:

import(java.util.HashMap)

main <- function() {

"Renjin example with Java"
ageMap <- HashMap$new()
ageMap$put("Bob", 33)
ageMap$put("Carol", 41)
print(ageMap$size())
age <- ageMap$get("Carol")
cat("Carol is ", age, " years old.\n", sep = "")

print(ageMap)

}

that will show:

Running script rtest_001.
[1] 2
Carol is 41 years old.
Script rtest_001 terminated.

And finally, and more interesting, we are going to show how to interact with gvSIG, accessing to one of the Views that is open in our project to show its name, importing the classes that we need:

import (org.gvsig.app.project.documents.view.ViewDocument)
import (org.gvsig.app.ApplicationLocator)

main <- function() {

 cat( "Accessing to a View\n" );
 application <- ApplicationLocator$getManager();

 view <- application$getActiveDocument(ViewDocument);
 print(view$name)

} 

It would show this text by console:

Running script rtest_02.
Accessing to a View
[1] "GVSIG VIEW 01"
Script rtest_02 terminated. 


We still have to find the best way to work with Renjin and gvSIG, since we still are in a development process of this module.

Any collaboration, or feedback that we get from you is welcome.

Posted in development, english, gvSIG Desktop, scripting | Tagged , | 3 Comments