PyConES es la conferencia nacional sobre Python más importante de España. La PyConES celebrará su tercera edición los días 20 a 22 noviembre de 2015 en Valencia, después de dos exitosas ediciones en Madrid y Zaragoza respectivamente y siguiendo el formato del evento mundial PyCon.
Concretamente, la conferencia tendrá lugar en la Universidad Politécnica de Valencia (UPV) y será organizada conjuntamente por la comunidad local y la asociación Python España.
Si queréis tener más información del evento lo mejor es que visitéis su página web.
Que un evento de este tipo fuera en Valencia era una oportunidad que no podíamos dejar escapar, así que presentamos una propuesta de taller que la organización ha tenido a bien incluir en el programa de actividades de la PyConES.
El taller “Python en gvSIG, el Sistema de Información Geográfica Libre”, tendrá lugar el viernes 20 de noviembre y servirá para introducir a los alumnos en la programación Python en un Sistema de Información Geográfica. ¡Programar con mapas siempre es mucho más atractivo!
Esperamos que el taller sirva tanto para animar a usuarios de gvSIG y Sistemas de Información Geográfica en general a programar con Python, como para atraer a programadores Python al mundo de la geomática.
En el anterior post explicábamos como instalar la librería jOpendocument y cómo descargar todo el material necesario para la ejecución del script.
Para este ejemplo solo vamos a necesitar el fichero que se encuentra en: C:\gvsig_informes\plantilla_invoice.ods. No es necesario que tengamos ninguna capa cargada en gvSIG.
Si utilizamos Linux o descargamos la carpeta en otro lugar de nuestro disco, tan solo deberemos de cambiar la ruta en el script que hace referencia a la plantilla de la hoja de cálculo: pathTemplate. Hay dos, una para el fichero de entrada plantilla_invoice.ods, y otra para el fichero de salida que podemos establecerlo donde queramos.
El siguiente script utiliza la librería jOpendocument para modificar el fichero ODS, asignándole a las celdas que queremos los valores deseados. Estos valores podrían provenir directamente de información de nuestras capas como explicamos en el post anterior.
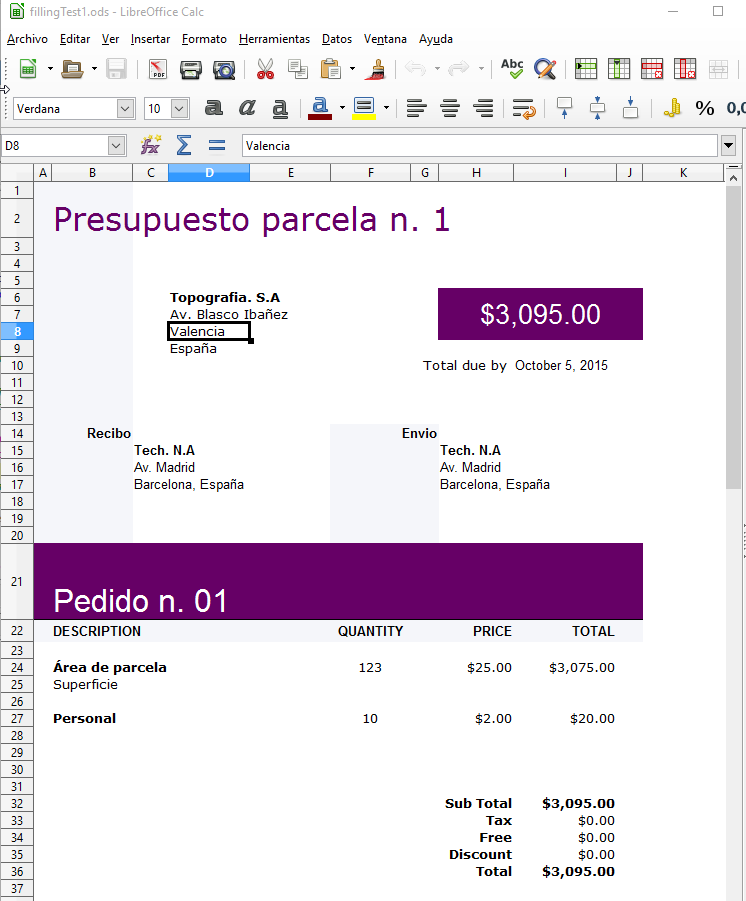
Al ejecutarse el script correctamente, se nos abre LibreOffice con el fichero creado. Si es como este caso que la hoja de cálculo influye fórmulas (sumas, multiplicaciones, etc), deberemos de presionar dentro de LibreOffice los botones Control+Mayúsculas+F9. Esto hará que se refresquen y actualicen todos los cálculos de la tabla. Veremos que se modifican algunas celdas.
El resultado sería un fichero similar a este:
El código es el siguiente, tan solo deberás de comprobar que las rutas sean correctas:
from gvsig import *

from java.io import File
from java.util import Date

from org.jopendocument.model import OpenDocument
from org.jopendocument.dom.spreadsheet import SpreadSheet
from org.jopendocument.dom import OOUtils

def main(*args):
    #Ejemplo de Edicion de ficheros ODS con jOpenDocument

    #basado en http://www.jopendocument.org/start_spreadsheet_2.html
    #ficheros plantilla http://www.jopendocument.org/downloads.html

    pathTemplate = r"C:/gvsig_informes/plantilla_invoice.ods"
    pathOutput = r"C:/gvsig_informes/resultado/fillingTest1.ods"

    #Acceso al spreadsheet y numero de hoja
    file = File(pathTemplate)
    sheet = SpreadSheet.createFromFile(file).getSheet(0)

    #Establecer fecha actual a la castilla I10
    sheet.getCellAt("I10").setValue(Date())

    #Titulo
    sheet.getCellAt("B21").setValue("Pedido n. 01")

    #Modifica el valor a la celda 1,1. Seria B2
    sheet.setValueAt("Presupuesto parcela n. 1", 1, 1)

    #Varias modificaciones a las celdas
    sheet.getCellAt("F24").setValue(123)

    sheet.getCellAt("B27").setValue("Personal")
    sheet.getCellAt("H27").setValue(2)
    sheet.getSpreadSheet().getTableModel("Products").setValueAt(10, 5, 4) #F27

    #Guardamos fichero
    outputFile = File(pathOutput)
    OOUtils.open(sheet.getSpreadSheet().saveAs(outputFile))
Espero que os sea de utilidad este post para la generación de informes y para mostrar la potencia de gvSIG Scripting al ampliarlo con librerías externas.
Cualquier duda nos podéis comentar en el post o en las listas.
Un saludo,
Óscar
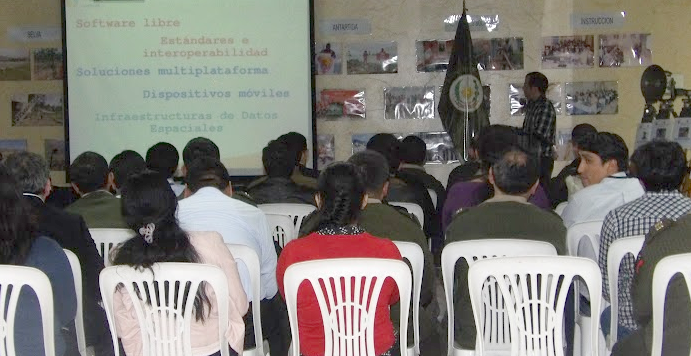
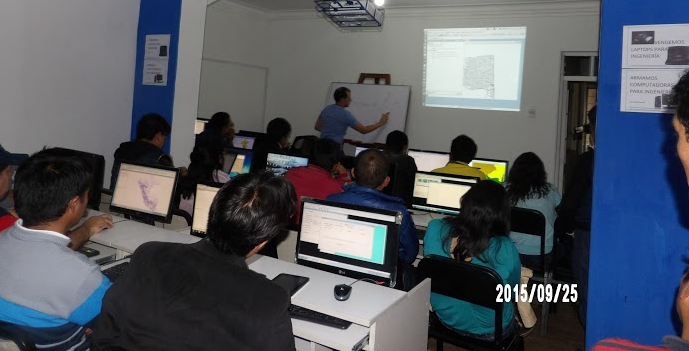
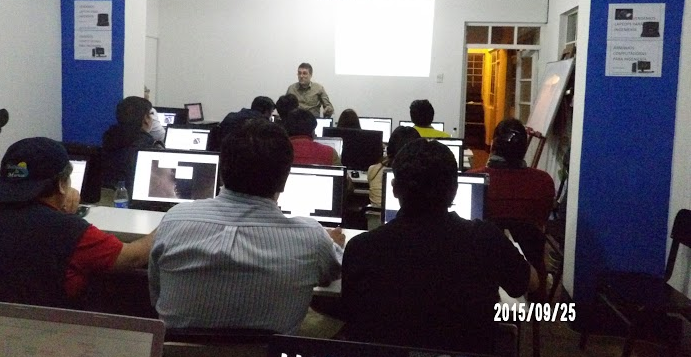
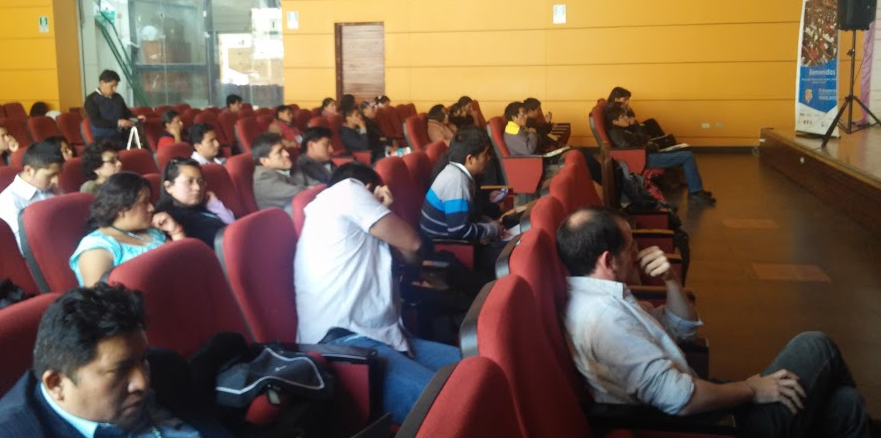
La pasada semana se celebraron en Huancayo las 2as Jornadas gvSIG Perú, y con una actividad previa organizada en Lima (Seminario Experiencias y Aplicaciones de las IDE con Geomática Libre).
Las Jornadas creo que van a suponer un impulso definitivo a la expansión de la geomática libre y las infraestructuras de datos espaciales en el país. Software libre y estándares son complementarios y no se entienden el uno sin el otro. El avance tecnológico en la gestión del territorio debe ir indiscutiblemente de la mano de ambos conceptos.
Estas jornadas han contado con la participación de los principales organismos relacionados con información geográfica de Perú, como la Oficina Nacional de Gobierno Electrónico e Informática (Presidencia del Consejo de Ministros) responsable de la IDE nacional, el Instituto Geográfico Nacional o el Colegio de Geógrafos del Perú.
Como es habitual en estos eventos lo mejor es el ambiente de colaboración y de apuesta por nuevos modelos basados en el conocimiento compartido y que permitan generar una industria nacional y regional cualificada. Apostar por la soberanía bajo modelos de colaboración y liberarse de cualquier dependencia tecnológica. Bajo estas premisas la Comunidad gvSIG Perú va a experimentar un considerable crecimiento a partir de estas jornadas.
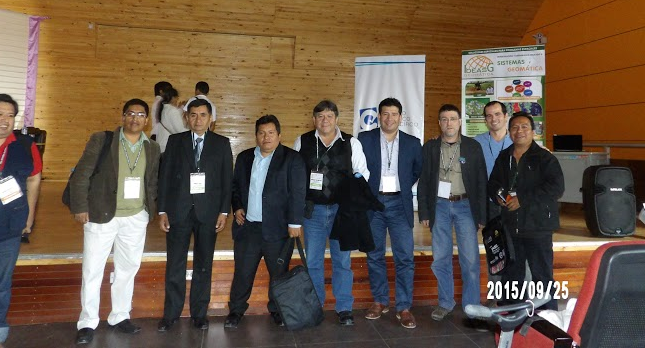
Aprovecho para agradecer el excelente trato y trabajo de IdeasG Geomática, colaborador de la Asociación gvSIG en Perú y en gran parte responsable del éxito de estas jornadas.
Os dejo con algunas imágenes del evento (ponencias, talleres de usuario y desarrollo, y ponentes destacados).
La realización de informes puede ser una tarea tediosa y repetitiva, la cual puede ser automatizada. Después de aparecer varias preguntas relacionadas con este tema en la Lista de Usuarios y visto que podía ser de utilidad para la comunidad, hemos desarrollado un script en el que mostraremos un camino para realizar esta automatización.
En este caso vamos a utilizar la librería jOpenDocument, una librería que nos permitirá editar ficheros de texto (odt) y hojas de cálculo (ods) de LibreOffice desde nuestro código.
Vamos a utilizar una plantilla y un script ya preparados para mostrar lo que sería el objetivo final de esta automatización. En este ejemplo tenemos un script que saca información de las parcelas que tengamos seleccionadas en una capa determinada. Para ello, accede a la información de varios campos de la entidad, y saca dos imágenes de nuestra Vista, una de la capa completa y otra sobre la entidad seleccionada. La escala que se aplicará a la imagen centrada sobre la entidad será la escala que tengamos en ese momento sobre la Vista.
El resultado que buscamos es este:
Para realizar la prueba, he preparado un fichero .zip que contiene todo lo necesario. Podéis descomprimir este fichero quedándose así en C:\gvsig_informes\. El script está preparado para esta ruta, si es otra, deberéis modificarlas al inicio del script.
Lo primero será instalar la librería jOpenDocument. En su web podéis encontrar documentación de ejemplos y su API. Para este ejemplo he utilizado jOpenDocument 1.3 que es la última versión estable. Lo podemos descargar, o copiar desde el zip que os habéis descargado. Es un fichero .jar (el facilitado en el .zip sería jOpenDocument-1.3.jar), el cual deberemos copiar a la carpeta \gvSIG\extensiones\org.gvsig.scripting.app.extension\lib de la carpeta de instalación de gvSIG. Normalmente será:
Para el ejemplo, ya en gvSIG, debemos de tener abierta en una Vista la capa de manzanas_valencia.shp que adjunto en el zip, y tener esta capa seleccionada en la Tabla de Contenidos (ToC) de la Vista (debe de aparecer en negrita). Además tenemos que seleccionar las entidades de las cuales queremos generar el informe.
Una vez esto, solo quedaría cargar nuestro script en el Módulo de Scripting, modificar las cuatro rutas que aparecen en él en caso de que fuera necesario, y ejecutarlo:
from gvsig import *
import sys
from geom import *
from java.io import File
from org.jopendocument.dom.template import JavaScriptFileTemplate
from org.jdom import Namespace
from com.sun.jimi.core import Jimi
from org.gvsig.app import ApplicationLocator
import time

def main(*args):
    #Input
    pathTemplate = "C:\\gvsig_informes\\plantilla_informe_test2.odt"

    #Output
    # Utilizar este formato con una unica barra
    pathOutputFile = r"C:/gvsig_informes/resultado/test_parcela%02d"
    pathEnvelope = r"C:/gvsig_informes/resultado/envelope.png"
    pathImageOut = r"C:/gvsig_informes/resultado/img%02d.png"

    #Inicio
    print "Informe parcelario"
    application = ApplicationLocator.getManager()
    layer = currentLayer()
    docvista = currentView()
    docwin = application.getDocumentWindow(docvista())

    #Get scale
    gsv = currentView().getMapContext().getScaleView()

    #Envelope global
    envelope = currentView().getMap().getLayers().getMapContext().getFullEnvelope()
    currentView().getMapContext().getViewPort().setEnvelope(envelope)
    time.sleep(2)
    img = docwin.getMapControl().getImage()
    Jimi.putImage(img,pathEnvelope)


    #Create images and odt
    n=0
    for f in layer.getSelection():
        print f.MASA, f.geometry()
        #Center view and set same scale
        geomf = f.geometry()
        centerView(geomf)
        currentView().getMapContext().setScaleView(gsv)
        time.sleep(2)
        #Imagen
        img = docwin.getMapControl().getImage()
        pathImage = pathImageOut % n
        Jimi.putImage(img,pathImage)

        # Create odt
        pathOutFile = pathOutputFile % n
        templateFile = pathTemplate #File(pathTemplate)
        outFile = File(pathOutFile)
        bcFile = pathImage
        template = JavaScriptFileTemplate(templateFile)

        values = f.getValues()
        template.setField("hoja", str(values['HOJA']))
        template.setField("area", str(values['AREA']))
        template.setField("coorx", f.COORX)
        template.setField("coory", f.COORY)
        ddoc = template.createDocument()
        ddoc.getDescendantByName("draw:frame","Imagen2").setAttribute("href", "file:///" + bcFile,Namespace.getNamespace("xlink", "http://www.w3.org/1999/xlink"))
        ddoc.getDescendantByName("draw:frame","Imagen1").setAttribute("href", "file:///" + pathEnvelope,Namespace.getNamespace("xlink", "http://www.w3.org/1999/xlink"))
        ddoc.saveAs(outFile)
        #template.saveAs(outFile)
        n += 1

def centerView(geomi):
        envelope = geomi.getEnvelope()
        currentView().getMapContext().getViewPort().setEnvelope(envelope)
        time.sleep(2)
Resumen de los pasos a seguir:
Descomprimir fichero del zip quedando el contenido en C:/gvsig_informes (en caso de que sea otra ruta se debe indicar en el script).
Copiar el fichero jOpenDocument-1.3.jar a la carpeta \gvSIG\extensiones\org.gvsig.scripting.app.extension\lib de la carpeta de instalación de gvSIG
Cargar capa manzanas_valencia.shp en gvSIG
Teniendo la capa activa en negrita en la Tabla de Contenido de la Vista
Seleccionar varias entidades de la capa
Ejecutar el script
Sin embargo, este script aún tiene un par de limitaciones:
Las imágenes en la plantilla solo pueden ser remplazadas, esto es, la imagen que cogemos en gvSIG tiene la forma del recuadro de la Vista, si es de diferente tamaño se deformará en la plantilla. Tiene solución si editamos la plantilla con imágenes adaptadas al tamaño que tengamos adecuado, o mediante programación se podrían hacer recortes en la imagen creada.
Las imágenes aparecen como enlaces relativos a ficheros de imágenes, por tanto, la imagen no queda realmente dentro de la plantilla, sino es un enlace a ella.
Si la plantilla contiene caracteres especiales como tildes me aparece error a la hora de crear el documento. No se seguro por qué aparece este error, tal vez un problema en la codificación o de la plantilla o de la librería.
Si el post resulta de interés para vosotros, publicaremos otros nuevos explicando los pasos seguidos en este para que comprendáis cómo poder modificarlo, y ejemplos de otros tipos como la edición de hojas de cálculo ods o mirar su exportación a PDF.
La librería jOpenDocument abre muchas posibilidades. Cualquier ayuda o aportación será bienvenida.
Espero que les sea de su interés.
Actualización para la versión gvSIG 2.3:
He realizado una actualización del script para la nueva versión de gvSIG. Adjunto el código abajo, pero también podéis descargos directamente el paquete de aquí e instalarlo desde el Administrador de Complementos. Después de instalarlo os aparecerá dentro de la carpeta Addons desde el Scripting Composer. El único requisito será tener asignada una carpeta output (se puede modificar), en este script aparece como “C:/gvsig_informes/resultados”. El jar y la plantilla lo coge de forma relativa, haciendo referencia a la propia carpeta del plugin.
This file contains hidden or bidirectional Unicode text that may be interpreted or compiled differently than what appears below. To review, open the file in an editor that reveals hidden Unicode characters. Learn more about bidirectional Unicode characters
Close your eyes. Dream. You are free to dream what you wish. To be the owner of your destiny. Dream that the speculation is dissipated to give way to collaboration. Dream that collective desires replace the egocentric individualism. Dream that cronyism disappear; that technological ignorance that excludes in an unfair and arbitrary way the Free Software to benefit Proprietary Software disappears, and especially when this decision follows the High Economic Value – Transnational pattern.
Follow with your eyes closed. Yes, it’s possible. We can change things, we can build a new business ethics, we can change the reality. Imagine a science in the service of humanity. An economy that meets efficiency and justice patterns. A policy that allows us to advance in levels of democracy and solidarity.
Open your eyes now. Not only it is possible, it is real. Change your dreams into reality. It depends on all of us.
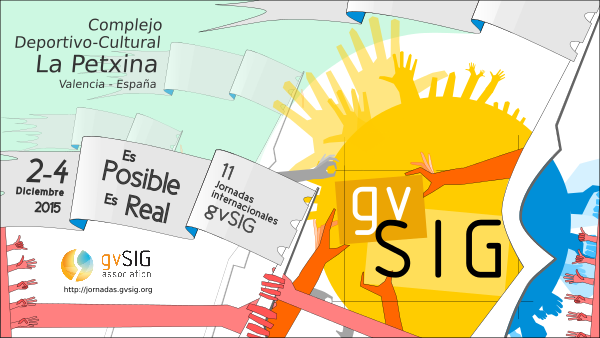
It is possible, it is real. Hold together the #11gvSIG like always, a space for exchange of ideas and experiences where economics, science and politics shake hand, because remember, gvSIG is not just science.
Cierra los ojos. Sueña. Eres libre para soñar aquello que desees. Para ser el dueño de tu destino. Sueña que se desvanece la especulación para dar paso a la colaboración. Sueña que los anhelos colectivos sustituyen al individualismo egocéntrico. Sueña que desaparecen los amiguismos; que desaparece esa ignorancia tecnológica que excluye de manera injusta y arbitraria al Software Libre en beneficio del Software Privativo, y sobre todo, cuando esta decisión responde al patrón Alto Valor Económico – Transnacional.
Sigue con los ojos cerrados. Sí, es posible. Podemos cambiar las cosas, podemos construir una nueva ética de negocio, podemos transformar la realidad. Imagina una Ciencia al servicio de la humanidad. Una Economía que responda a patrones de eficiencia y de justicia. UnaPolíticaque nos permita avanzar en cotas de democracia y solidaridad.
Abre ahora los ojos. No solo es posible, es real. Transforma tus sueños en realidad. Depende de todos nosotros.
Es posible, Es real. Celebremos juntos las #11gvSIG como siempre, un espacio de intercambio de ideas y experiencias donde Economía, Ciencia y Política se dan la mano, porque recuerda, gvSIG no es sólo ciencia.
Would you like to create your own customized distributions with gvSIG? Do you think that the gvSIG distribution should include symbol libraries by default or pre-installed additional functionalities? Do you need an adapted gvSIG in your organization?
Now we present a new plugin for gvSIG that solves those questions. Like any new plugin, the idea is to be tested by you and start using it from now.
We could say that this plugin “is not for all users”, but it covers a need that many organizations have: to have a customization of gvSIG with adapted features, like a default CRS at the installation, different than EPSG 4326, having it in a particular language, containing a series of OGC services used by the organization, including certain plugins, having concrete symbol libraries, etc.
This plugin allows that options and more; with this plugin you will also be able to customize features of gvSIG, like the name of the distribution or the splash that appears when you launch the application. And best of all, without having to develop any line of code and maintaining full compatibility with the official versions.
The first thing you should know is that this plugin is available for Linux gvSIG users. The add-on will not work from gvSIG in Windows, at least at this moment. That’s for sure, from your gvSIG distribution in Linux you can generate any current distribution: gvSIG for Linux 64-bit, for 32-bit Linux or for Windows.
Let’s look at 3 videos about how to work with this plugin.
At the first video we can see how to install it … nothing new … through the add-ons manager. It’s important to look for it at the “Testing gvSIG repository” because it is a complement in testing phase. At this repository we will look for the “Customize” plugin in its latest version (1.2.2-12) and we will mark it to install. Once installed, we have to restart gvSIG.
In this second video we can see how to configure and create the new distribution. Although it may seem complex … it is really quite simple, and you will see that in a few minutes you can create a customized gvSIG without difficulty.
In the “Tools” menu you will find a “Customize” submenu with 2 options, the second one allows you to edit the configuration file that will determine the characteristics of your “new gvSIG” …
… a new window with multiple tabs will be opened. Each tab allows you to configure a number of characteristics of gvSIG: the default language, the default CRS, the OGC services, …
In the OGC services you have to take into account that we can list the existing ones in our gvSIG, and delete them or add new services. In the video we have removed and added WMS and WMTS services (in the third video you will see the results).
We have also changed the default language, the CRS (EPSG 25830 instead of 4326), the application name(we renamed it as gvSIG Testing instead of gvSIG) and the splash that appears when launching the application.
You will see that there are other tabs that we have not modified (Proxy, WFS, WCS, and several ones related to scripting). The related to scripting ones will allow us to associate scripts to buttons, menus or the Table of Contents (TOC) contextual menu. Most of these tabs are under development and not necessarily working in this plugin version … but you can test it and tell us how it works.
Once the characteristics of the configuration file of our new gvSIG are indicated, we will select what add-ons or features we want to have by default. For that we will go to “Tools”, “Customize” and “Create distribution” menu. A window like the one in the video will appear, where we have to indicate (it is recommendable in this order):
Working folder: The folder where the installation file of your distribution will be saved.
Distribution id: ID Distribution name
Online installer: gvSIG online installer, which is used to create the distribution. This installer can be downloaded from all generated gvSIG versions and it contains a basic gvSIG without plugins. There are an online installer for Windows and Linux. For example, you can download gvSIG 2.2 online installer from here: http://downloads.gvsig.org/download/gvsig-desktop/dists/2.2.0/builds/2313/. The files named with “lin” are for Linux, and with “win” are for Windows.
Package set: we indicate the file that contains all the plugins or add-ons. In the same link indicated in the previous link we can download the plugins file for Linux (32 and 64bit) and Windows. They are the files with extension: gvspks.
Once the package file is indicated, gvSIG will start to read all the add-ons that are available and will list in the “Package set” tab. Here you can define which of these supplements you want to have by default.
In the example several additional symbol libraries and 3D functionality have been selected.
In this section we would also be able to add new plugins that were not in the “package set” file or remove any of the existing ones.
After the selection of plugins, we will click on “Create” button and the installation file will be created.
The video shows how gvSIG creates different files in the working folder. We only will take the installation file.
Now we have our customized gvSIG installation file.
In the third video we will see the results after installing it. In the first starting we see how the installation is completed, adding the selected symbols libraries. We check that gvSIG is installed with the selected characteristics: new splash, new title, CRS 25830, several WMTS and WMS by default and other pre-existing ones removed, new symbol libraries and the 3D plugin included by default.
Note: Changing the configuration file also makes some changes on the gvSIG that you have installed, so you can use this functionality to make certain customizations to your current gvSIG.
We are sure that this plugin will be very useful for organizations that use gvSIG. It shows, once again, how gvSIG continues an unstoppable progress of improvements in 2.x versions.
At this post we are going to see a new utility of the geopy library, where we’ll see how to convert a table with addresses to a point layer in gvSIG. The addresses will be searched in Google Maps, so you can search places of interest too (parks, museums…). That layer will be created with the results.
This script will read all the addresses that we have in a table, and they will be converted to coordinates through the geopy library (making requests via Internet, using the Google encoder). They will be added to a new point layer in gvSIG.
The script will keep the rest of the structure of the table if we have more data.
The first step will be to install the GeoPy library if we didn’t have it installed (you can see the instructions at the previous post, Look for your address or location in gvSIG using Scripting!, that includes a video too). Then you have to run gvSIG and create the script.
Once the new script has been created we have to copy this source code on it:
from gvsig import *
from geom import *
from geopy.geocoders import get_geocoder_for_service
def getGeometryType(type, subtype):
 geometryManager = GeometryLocator.getGeometryManager()
 return geometryManager.getGeometryType(type,subtype)
def main(*args):
    """ Add the address to point layer """
    ### Initial data
    fieldAddress = "Address" #Field of the table
    path = "/home/myuser/gis/point_layer.shp"
    ### Process
    #We copy the scheme of the table at the layer + geometry
    layer = currentTable()
    schema = layer.getSchema()
    newSchema = createSchema(schema)
    newSchema.append("GEOMETRY", "GEOMETRY")
    newSchema.get("GEOMETRY").setGeometryType(getGeometryType(POINT,D2))
    CRS = currentView().getProjection()
    output = createShape(newSchema, path, CRS=CRS, geometryType=POINT)

    # Used locator: Google v3
    geolocator = get_geocoder_for_service("googlev3")

    #The table is read
    for feature in layer.features():
        address = feature.get(fieldAddress)
        #..converting a location
        location = geolocator().geocode(address)
        values = feature.getValues()
        try:
            print location.longitude, location.latitude
            #..creating a point with the values of the geolocator
            point = createPoint(location.longitude, location.latitude)
            values["GEOMETRY"]=point
            #..creating the geometry and adding the new layer
            output.append(values)
        except:
            pass

#adding the new layer to the view and finishing editing.
    currentView().addLayer(output)
    output.commit()
Important: We have to modify these parameters at the script, at this text: “### Initial data”:
We specify the name of the field that contains the addresses or type of locations. It will be done modifying the fieldAddress variable, changing “Address” by the name of the field of our table.
We change the path where the new layer will be created and its name, modifying the ruta variable.
Once the Script is created and saved, we will open a table that contains a field with the addresses or type of locations.
Now, before running it, we have to take into account that we have to have the table opened in the forefront, and a View behind it. That’s because at the script we are referring to the active table.
The script, has some limitations because it depends on the online service offered by Google (we also can use other encoders, listed at geopy website), but it has other advantages. For example, we can search by fields that are not postal addresses, like “Guggenheim Museum”, city names, countries…
You can find this script and many more at the gvSIG Outreach.
If you have any doubt you can write here or use the mailing lists.
En este post vamos a ver una nueva utilidad de utilizar de la librería geopy, donde veremos la forma de convertir una tabla con direcciones postales en una capa de puntos en gvSIG. Las direcciones se buscarán en Google Maps, por lo que también se pueden buscar lugares de interés (parques, museos…). Se generará dicha capa con los resultados encontrados.
Lo que va a realizar el siguiente script será leer todas las direcciones que tengamos en una tabla, convertirlas a coordenadas mediante la librería geopy (haciendo peticiones vía Internet usando el codificador de Google) y añadirlas a una capa nueva de puntos en gvSIG.
El script también guardará el resto de la estructura de la tabla si tenemos más datos en ella, perfecto para convertir tablas que tengáis en capas.
Lo primero que debemos hacer es instalar la librería GeoPy si no la teníamos instalada (ver los pasos a seguir para ello en el post anterior Busca tu dirección o población en gvSIG mediante Scripting, que incluye también un vídeo explicativo). Después arrancar gvSIG y crear el Script.
Una vez creado el nuevo script deberemos copiar el siguiente código en él:
from gvsig import *
from geom import *
from geopy.geocoders import get_geocoder_for_service
def getGeometryType(type, subtype):
 geometryManager = GeometryLocator.getGeometryManager()
 return geometryManager.getGeometryType(type,subtype)
def main(*args):
    """ Agregar a capa de puntos la direccion """
    ### Datos iniciales
    fieldAddress = "Direccion" #Campo de la capa tabla
    ruta = "/home/miusuario/gis/capa_puntos_de_puntos01.shp"
    ### Proceso
    #Copiamos el esquema de la tabla en la capa + geometria
    layer = currentTable()
    schema = layer.getSchema()
    newSchema = createSchema(schema)
    newSchema.append("GEOMETRY", "GEOMETRY")
    newSchema.get("GEOMETRY").setGeometryType(getGeometryType(POINT,D2))
    CRS = currentView().getProjection()
    output = createShape(newSchema, ruta, CRS=CRS, geometryType=POINT)

    # Locator usado: Google v3
    geolocator = get_geocoder_for_service("googlev3")

    #Recorremos la tabla
    for feature in layer.features():
        address = feature.get(fieldAddress)
        #..convertimos a location
        location = geolocator().geocode(address)
        values = feature.getValues()
        try:
            print location.longitude, location.latitude
            #..creamos punto con los valores devueltos por el geolocator
            punto = createPoint(location.longitude, location.latitude)
            values["GEOMETRY"]=punto
            #..creamos la geometria y agregamos a la nueva capa
            output.append(values)
        except:
            pass

#Agregamos la capa a la Vista y cerramos edicion.
    currentView().addLayer(output)
    output.commit()
Importante: Deberemos modificar lo siguiente en el script, donde pone “### Datos iniciales”:
Especificaremos el nombre del campo que contiene las direcciones o tipos de lugares. Se hará modificando la variable fieldAddress, cambiando “Direccion” por el nombre del campo que tengamos en la tabla.
Cambiaremos la ruta en la que se creará la nueva capa y su nombre, modificando para ello la variable ruta.
Una vez creado y guardado el Script, abriremos una tabla que contenga un campo con las direcciones o tipos de lugares.
Ahora, antes de ejecutarlo, hay que tener en cuenta que hay que tener la tabla abierta en primer plano y una vista detrás, ya que en el script hacemos referencia a la Tabla activa.
El script, al depender del servicio online que ofrece Google (también podemos usar otros codificadores como podemos ver en su web), cuenta con algunas limitaciones pero también con ventajas. Por ejemplo, podemos realizar búsquedas con campos que no sean totalmente direcciones postales, del estilo “Museo Guggenheim”, nombres de ciudades, países.
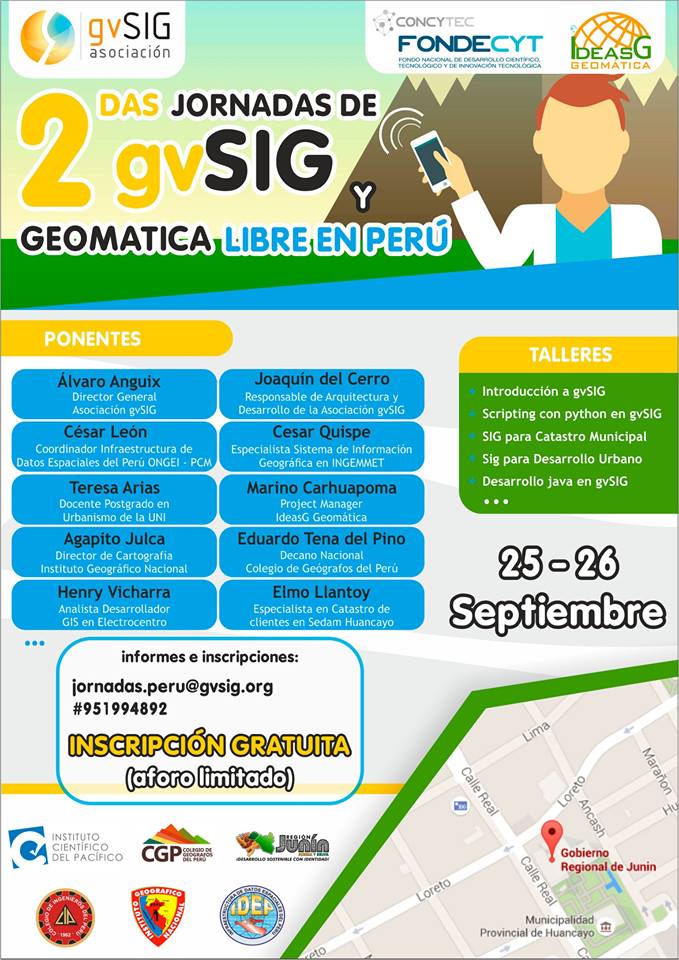
En pocos días estaremos celebrando las 2as Jornadas gvSIG Perú, que este año tienen lugar en Huancayo, durante el 25 y 26 de septiembre.
El programa de ponencias y talleres ya está disponible y podéis consultarlo en la web del evento.
Por parte de la Asociación gvSIG estaremos mi compañero Joaquín del Cerro -responsable de arquitectura y desarrollo de gvSIG- y yo mismo, participando tanto en ponencias como en los talleres.
Durante las jornadas podréis asistir de forma gratuita (tan solo hace faltainscribirse) a cerca de una veintena de ponencias y a 5 talleres en los que podréis aprender tanto el uso de gvSIG como iniciaros en la programación de gvSIG ya sea en Java o mediante Python.
¡No os podéis perder esta oportunidad de aprendizaje!
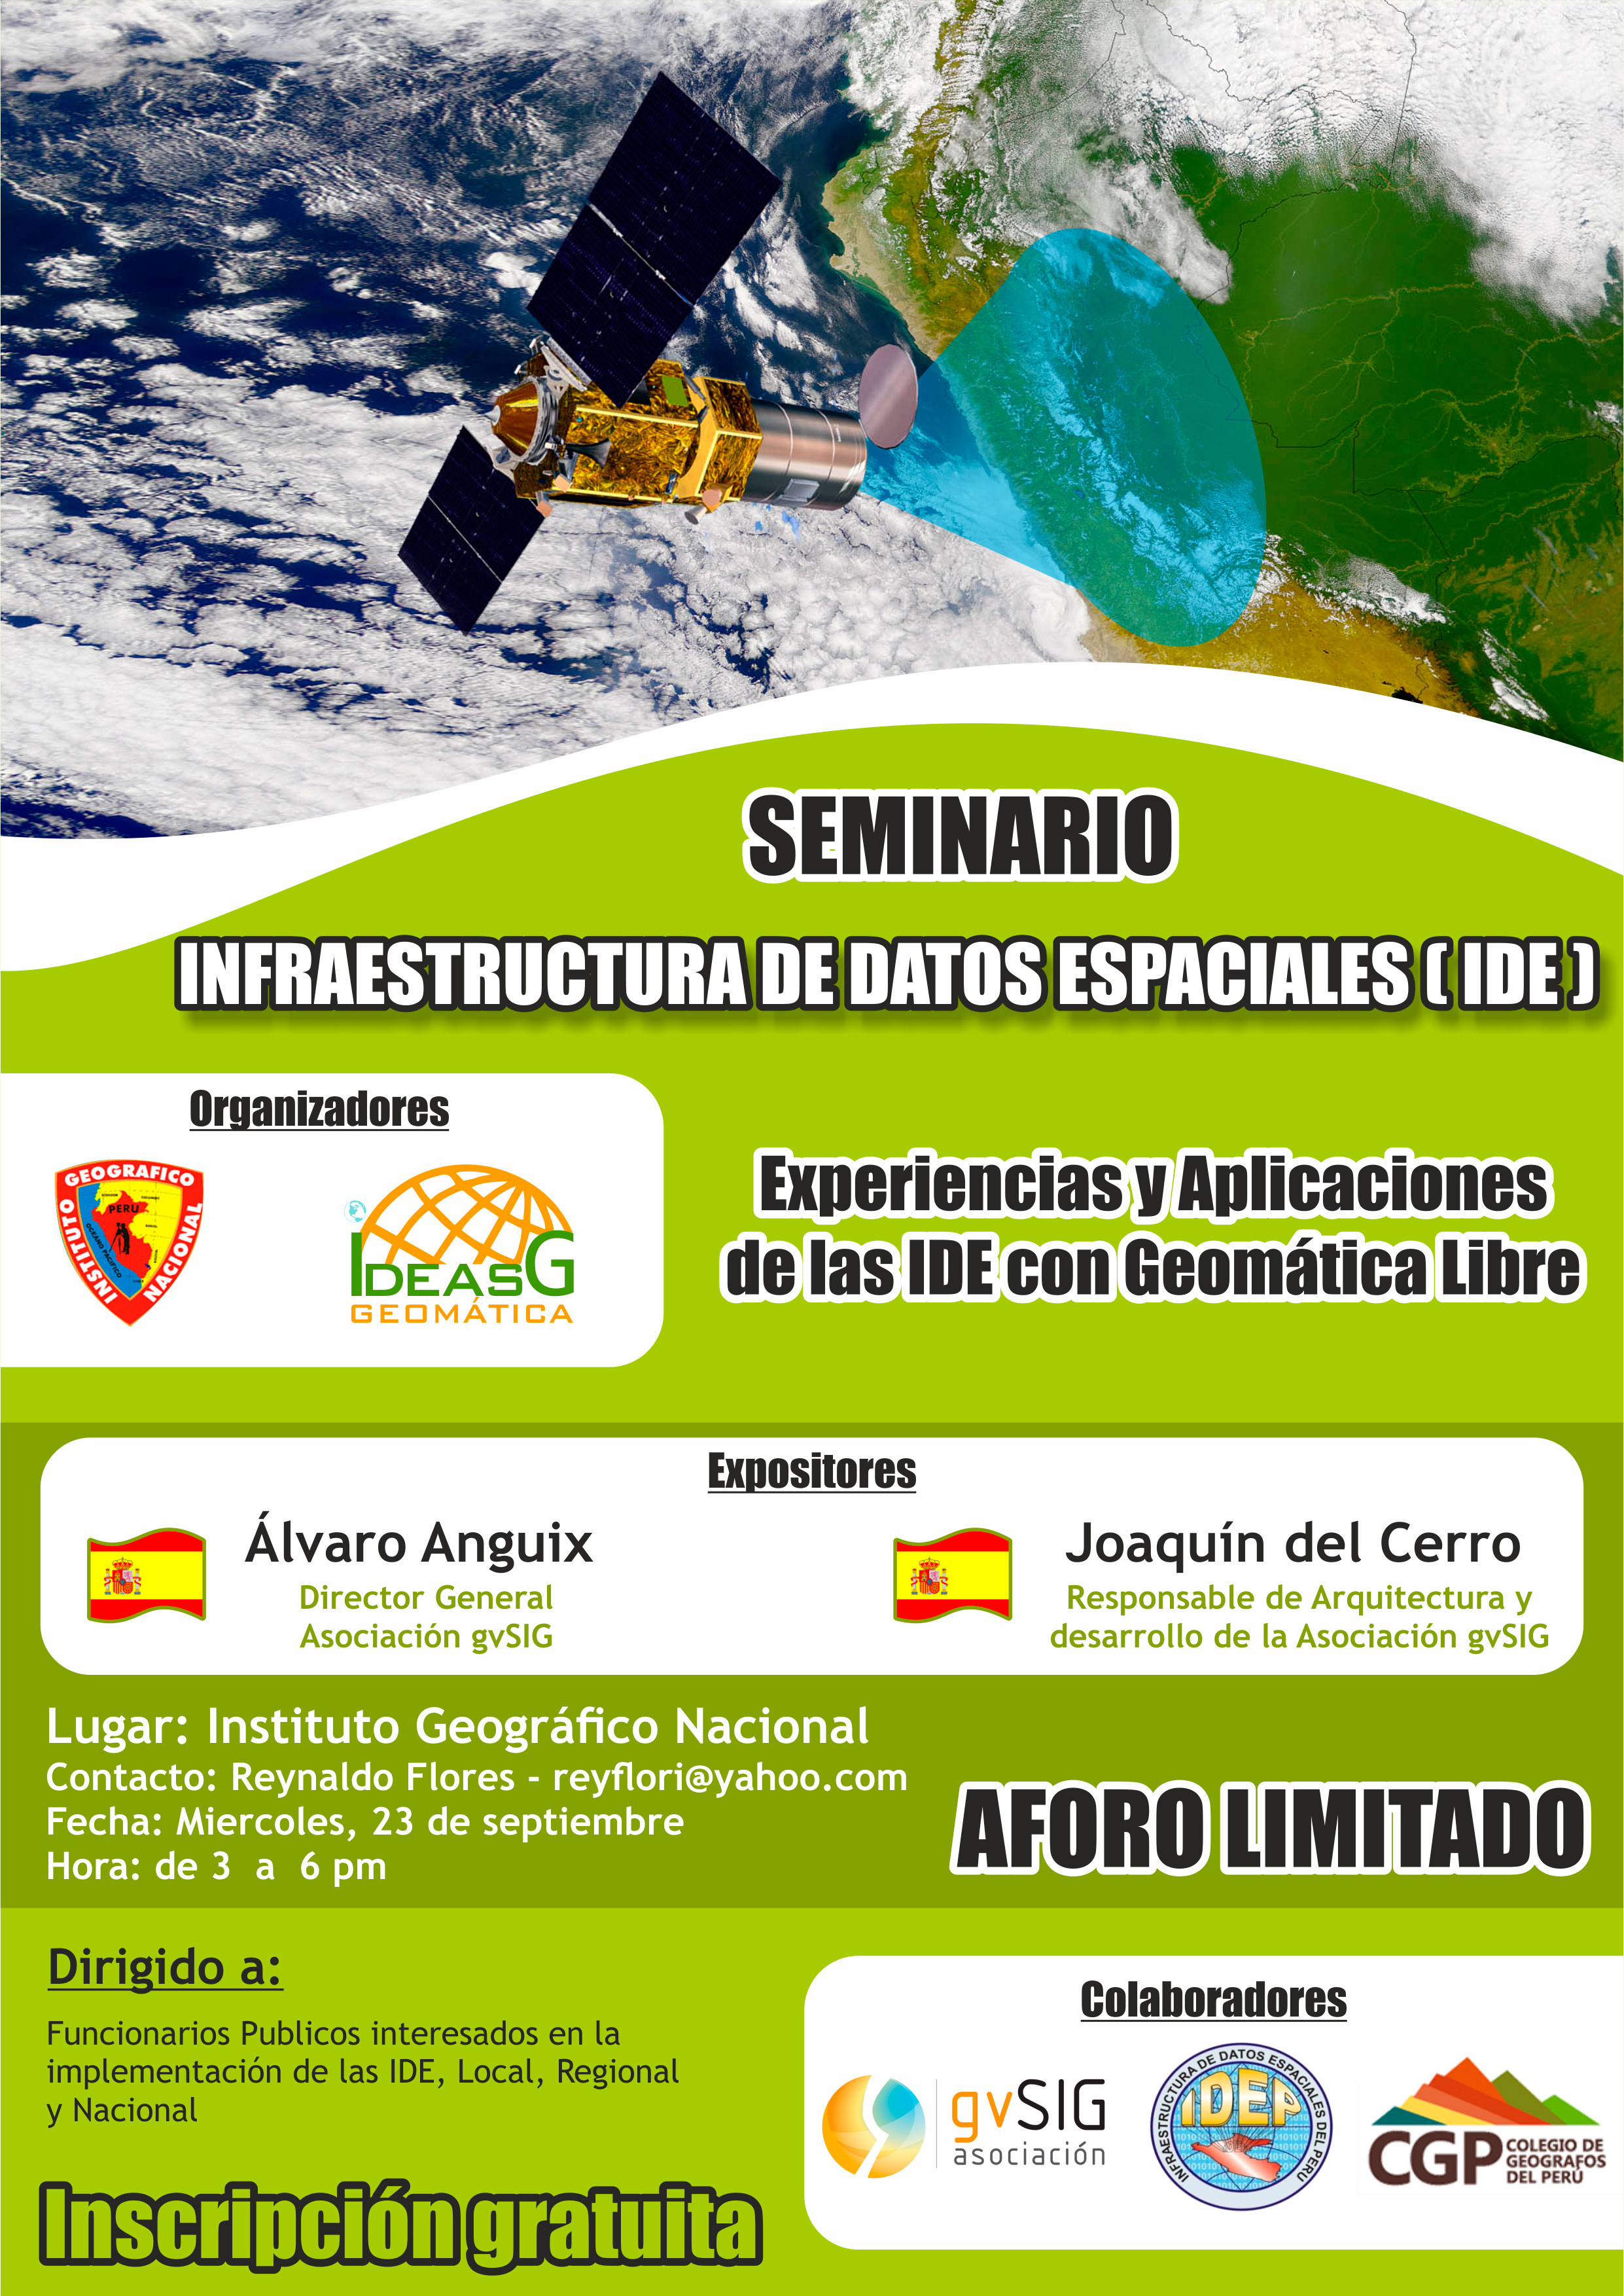
Como actividad pre-jornadas, el día 23, se celebrará en Lima el seminario “Infraestructura de Datos Espaciales: Experiencias y Aplicaciones de las IDE con Geomática Libre”. Y, por supuesto, de inscripción gratuita.
Os dejo el cartel de este evento para que tengáis toda la información:

 PyConES es la conferencia nacional sobre Python más importante de España. La PyConES celebrará su tercera edición los días 20 a 22 noviembre de 2015 en Valencia, después de dos exitosas ediciones en Madrid y Zaragoza respectivamente y siguiendo el formato del evento mundial PyCon.