
During the 13th International gvSIG Conference in Valencia and 4th gvSIG Conference in Mexico, several workshops were given about R integration in gvSIG and some development examples with R.
From the gvSIG Association we want to share all this material to be avalaible for test and consulting. You can download it from this link. Besides from a layer about Brasil, all the data in the workshop has been downloaded from the UK Police Open Data portal.
We are going to explain some of the examples:
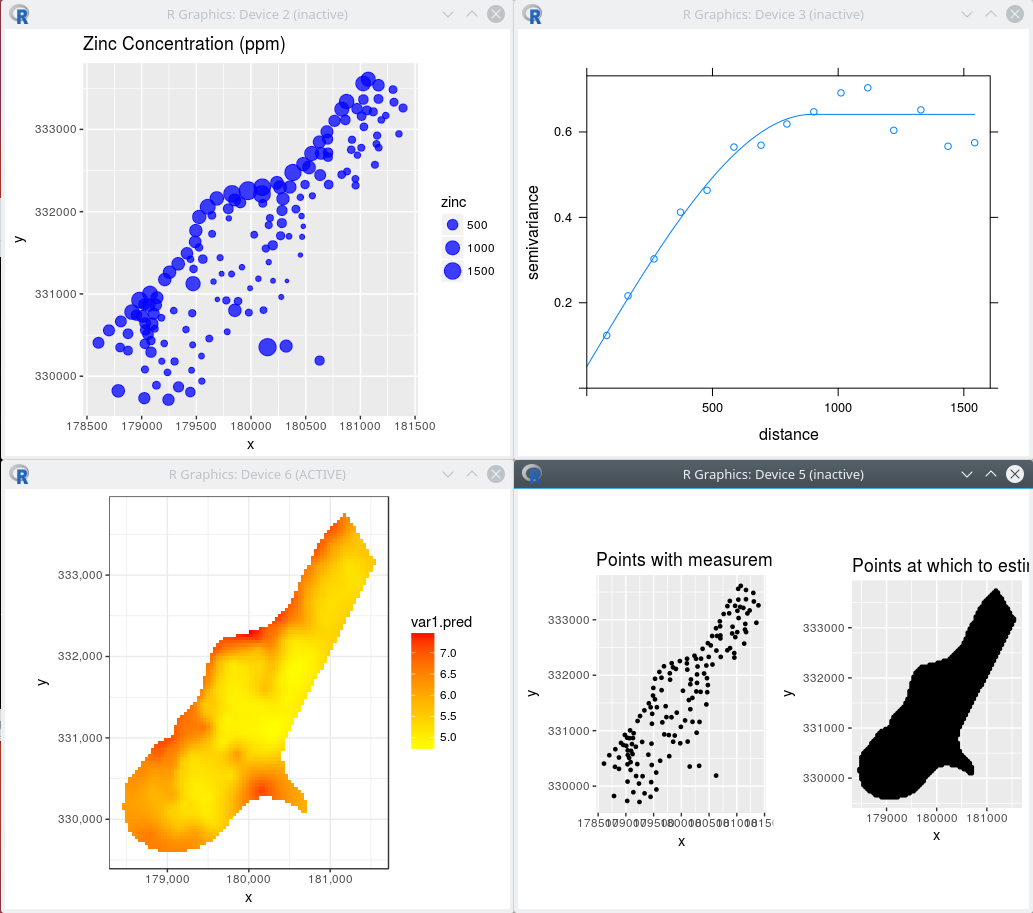
- Test1 – Kriging example. based on a example found in here. The target was learn how to adapt a script to gvSIG.
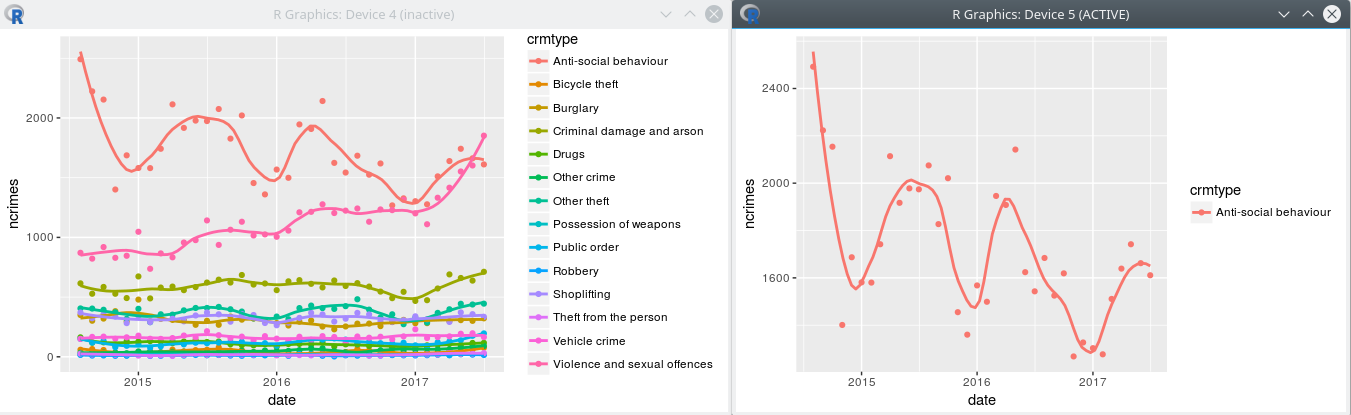
- Test 11: Descomposition. Reading csv files about UK crimes we’ll try to analyze if there is a seasonal component based on time series. We also create a prognostication about the crimes in the future for that region.

- Test12: Mean Center. An analysis of the mean center for crimes point cloud in the region of North Wales. Also, there is the data to calculate the city of London. In the North of Wales zone it can be appreciated that the Y-axis, corresponding to latitude value, it has a seasonal component. The mean center moves to the East in Winter, and to the West in Summer. We also calculate the number of total crimes (ncrimes column).

- Test 2:R example for transformation of multiple csv files (UK Crimes) to an unique shapefile. The input parameter is the folder of the csv files.

- Test 3: Mapa. Simple example to show how to pass parameters from gvSIG to R.

- Test 4: Simple example of R plot.

The workshops were made using gvSIG 2.3.1. If you are using a gvSIG portable version, the R plugin is already inside. If you are using a gvSIG installable version, you should install the “R” plugin from the Plugin Administrator.
An error that can occur is the lack of some R libraries. To do this you should install them from the R Console manually. This steps could be automatize. For example, if an error similar to “Error library tcltk2 not found”. If this happen, you need to install the libraries writing in the R console: install.packages(“tcltk2”).
The libraries that you could need are: tcltk2, forecast, xts, lattice.To open the R console, you need to go to the tab “System” in the scripting composer, search the module r.extension, and execute the script RShell as we explain in this documentation.
To install the data of the workshoop, you can do it from the Plugin Administrator -> Install package from file. select the previous downloaded file. Once is installed, go to the Scripting Composer inside Tools -> Scripting. Inside the addons folder you will find the workshop.
If you want to execute one example of r, you will have to execute it from the python file that handle the execution. Each ejemploN.py execute testN.r
There are only to script that need special attention:
- test2: you need to open a View with the projection 4326
- test3: you need to have a View open with the layer UFEBRASIL. In that view, you need to select in the Table of Contents the layer, this one will appear in bold.
With a little bit of development, these conditions could be managed but as the purpose of the workshop is keep it simple we didn’t do it.
Any question can be asked in the mailing list.
Hope you like it!
Some of the references we have used for the workshop:
- Learning Data Analysis with R – Packpub
- Learning R for Geospatial Analysis
- An Introduction to R for Spatial Analysis and Mapping
- Course materials for ‘Spatial Data Analysis with R’ – Virgilio Gómez Rubio


